CK-12 Foundation
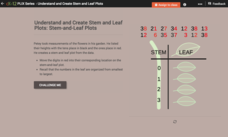
Understand and Create Stem-and-Leaf Plots: Stem-and-Leaf Plots
Explore the advantages to using a stem-and-leaf plot using an online lesson. Learners manipulate an animation to create a stem-and-leaf plot. They then calculate statistics for the data using their display. Guiding questions help them...
American Statistical Association
Tell it Like it is!
Scholars apply prior knowledge of statistics to write a conclusion. They summarize using correct academic language and tell the story of the data.
Curated OER
Describing Data
Your learners will practice many ways of describing data using coordinate algebra in this unit written to address many Common Core State Standards. Simple examples of different ways to organize data are shared and then practice problems...
Curated OER
Fall Leaves
In this fall leaves worksheet, students identify the colors of leaves and determine the number they have of each. This worksheet may be used in elementary grades, for color identification and counting purposes. For the middle school...
Curated OER
What Are Your Favorite Apples?
In this tally learning exercise, students take a survey to determine the favorite apple. They write tally marks beside the apple chosen. For elementary students, this learning exercise may be used for counting purposes and to reinforce...
Curated OER
Data Collection Project
Students collect data using email. They calculate the mean, median, mode, range and outliers. They create a graph using the data results. They write five paragraphs to summarize their data.
Curated OER
Box Plots
In this statistics worksheet, students analyze problems by finding the mean, median and mode. They also set data by their median, and quartiles. There are 7 questions dealing with 2 different sections.
Curated OER
Stem-and-Leaf Plots
In this stem-and-leaf plots worksheet, 9th graders solve and complete 9 various types of problems. First, they determine the mean, median, and mode of the stem-and-leaf plot shown. Then, students summarize the similarities and...
Curated OER
Handling Data: measure of Average
Fifth graders analyze data from a simple table. In this graphing lesson, 5th graders compare distributions. Students recognize that the mean helps them find the formula. Students answer questions on the mean, median, and range.
Curated OER
How Many Animals?
Students use their math skills to develop estimates for the population of several animal species native to the Austrailian rainforest. It is a simulation that researchers at the Center for Rainforest Studies in Australia perform to...
Houghton Mifflin Harcourt
Unit 3 Math Vocabulary Cards (Grade 5)
Fifty-four flashcards make up a set to help reinforce math vocabulary. The set offers two types of cards; a word card printed in bold font, and a definition card equipped with an example and labels. Terms include capacity, histogram,...
Curated OER
The Guise of a Graph Gumshoe
Eighth graders practice constructing bar, circle, and box-and-whisker graphs. They practice reading and interpreting data displays and explore how different displays of data can lead to different interpretations.
Curated OER
Comparing Data
Eighth graders create a survey, gather data and describe the data using measures of central tendency (mean, median and mode) and spread (range, quartiles, and interquartile range). Students use these measures to interpret, compare and...
Curated OER
Word Power
Fifth graders identify a set of data from a real world problem. In this statistics lesson, 5th graders identify the range, mode, median and mean using some manipulatives. They write words randomizing the letters.
Curated OER
What is a Box and Whisker Plot?
Eighth graders explore the correct use of box and whisker plors. The times when they are appropriate to use to compare data is covered. They plot data according to statistical analysis including mean, median, and mode.
Curated OER
Math Can Be Mean!
Fifth graders are introduced to the topic of means. Calculating the mean, mode and median, they describe what each set of numbers tell and do not tell about the data. They use a line graph to practice finding the mean. They also use...
Curated OER
Live, From New York
In this data analysis worksheet, students study the information on a data table about the hosts of Saturday Night Live. Students answer 8 problem solving questions about the table.
Curated OER
Math: Giant Alaskan Cabbages
Students analyze data from the Alaska State Fair's "Giant Cabbage Weigh-Off." Once they have sorted the weights, they calculate the range, mean, mode, and median of the cabbages. Finally, students create posters displaying their...
Curated OER
Probability and Statistics - Week 10
In this probability and statistics worksheet, students find compound dependent and independent probability of given situations. They identify the mean, mode, range and median of sets. This two-page worksheet contains explanations,...
Curated OER
Statistically Lyrical
Young scholars examine and discuss the writing of ratios as fractions and where they can be found in the real world. They complete worksheets and a questionnaire, and calculate the mean, median, and mode scores for the class.
Curated OER
What a Square
Students examine the painting "Old Man With A Gold Chain" by Rembrandt. They identify geometric shapes in the painting, measure these shapes and compare the relationships of these measurements.
Curated OER
Drops on a Penny
A helpful activity describes an interesting demonstration on the surface tension of water. Learners guess how many drops of water the heads side of a penny will hold. This resource does a great job of describing just how a penny can hold...
Curated OER
Plotting with Pennies
Fifth graders use pennies to gather data, organize and order data, graph the data on a stem-and-leaf plot, and evaluate the range, median, and mode of the data.
Curated OER
Opening the Case
Young scholars participate in a class survey and then design an experiment and use graphs and statistics to assist them in solving a problem. They organize the results of the survey in a stem-and-leaf plot and find the range, median,...
Other popular searches
- Mean Median Mode Range
- Mean, Median, Mode Range
- Mean, Median, Mode, Range
- Mean Median Mode and Range
- Range, Mean, Median, Mode
- Mean, Median, Mode, and Range
- Mode Median Range
- Mean, Median, Mode and Range
- Statistics Median Mode Range


