Curated OER
My Peanut Butter is Better Than Yours!
Students explore the concept of statistical data. In this statistical data lesson, students read an article about the dangers of peanut butter to those who are allergic. Students perform a taste test of two different brands of peanut...
Curated OER
Unit 18 Quantitative Data
In this central tendency worksheet, students answer 30 short answer questions about data sets. Students find the median, mean, mode, and range of data sets.
Curated OER
Atlatl Lessons Grades 4-12: Lesson for Beginning Users of Atlatl
Sixth graders determine the mean, range median and mode of a set of numbers and display them. In this data activity students form a set of data and use computer spreadsheet to display the information. They extend of the process by...
Curated OER
Mean Absolute Deviation in Dot Plots
The lesson focuses on the ideas of dot plot representations and the mean absolute deviation of data sets.
Curated OER
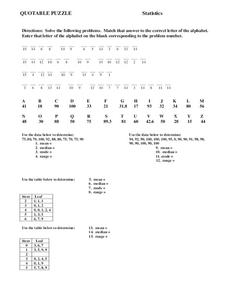
Statistics
In this statistics worksheet, 8th graders solve and complete 15 different problems. First, they solve each problem by using the data given to determine the mean, median, mode, and range for each set. Then, students match that answer to...
Curated OER
Describing Data
For this describing data worksheet, students answer multiple choice questions about mean, median, mode, and range. Students complete 10 questions total.
Curated OER
Family Size
In this family size activity, students complete a tally chart to determine data from a family size line plot. They organize the data in the chart to determine the mean, median, mode, and range of the data. There are six problems in...
Curated OER
Measures of Central Tendencies: Quartiles
In this statistics worksheet, students calculate the mean, median, mode, range, lower quartile, and upper quartile for 10 questions and interpret a box and whiskers graph.
Curated OER
Making Data Meaningful
In this sample mean worksheet, students explore different ways "average" is used. Students use this information to find the sample mean of the height of a large class of students. Students find the mean, median, mode and range of two...
Math Mammoth
Stem-and-Leaf Plots 3
In this stem-and-leaf instructional activity, students place statistical data in a stem-and-leaf plot. They identify the median, and range in a given set of data. There are four multi-step problems on this one-page instructional activity.
Curated OER
Mean, Median and Mode
Students define mean, median, mode and outliers. In this statistics lesson, students analyze data using the central tendencies. They follow a path through a maze collecting data. They analyze the data using the mean, median and mode.
Curated OER
Data Analysis
In this data analysis worksheet, students answer 4 questions using a weather report chart. Topics include mean, median, mode and range.
Curated OER
Mean, Mode, Median, and Range
In this math worksheet, learners read about the mean, mode, median, and range. Students analyze a color-coded example problem for each.
Curated OER
Measures of Central Tendency
For this measures of central tendency worksheet, students solve and complete 6 different problems. First, they count the number of items in each set of data. Then, students determine the mean, median and mode for each. In addition, they...
Curated OER
Mean, Mode, Range, Median
In this weather instructional activity, learners look at the average monthly temperatures and precipitation for their own city to determine the mean, mode, range, and median. This instructional activity has 8 fill in the blank questions.
Centre for Innovation in Mathematics Teaching
Ten Data Analysis Activities
This thirteen page data analysis worksheet contains a number of interesting problems regarding statistics. The activities cover the concepts of average measurements, standard deviation, box and whisker plots, quartiles, frequency...
Virginia Department of Education
Calculating Measures of Dispersion
Double the fun — calculate two measures of deviation. The lesson plan provides information to lead the class through the process of calculating the mean absolute deviation and the standard deviation of a data set. After learning how to...
Inside Mathematics
Suzi's Company
The mean might not always be the best representation of the average. The assessment task has individuals determine the measures of center for the salaries of a company. They determine which of the three would be the best representation...
Curated OER
Fall Leaves
For this fall leaves worksheet, students identify the colors of leaves and determine the number they have of each. This worksheet may be used in elementary grades, for color identification and counting purposes. For the middle school...
Curated OER
Data Analysis
In these data analysis worksheets, students complete 4 worksheets of activities for analyzing data. Students use the mean, median, mode, and range to organize the data.
Curated OER
Collecting, organizing and comparing data for cellular telephone buying and calculating average, and median price and best deal per cost.
Pupils research data and develop statistical methods such as mean and median price and make convincing arguments as powerful ways for decision making.
Curated OER
Global Statistics
Students determine statistics based on data. In this statistics lesson, students use data and record in charts. Students create graphs based on the statistics found.
Curated OER
Averages
In this averages worksheet, 6th graders solve and complete 3 various types of problems. First, they find the mean, mode, median and range for each set of data shown. Then, students match each team to the picture shown that they think...
Curated OER
Statistics
In this statistics worksheet, 8th graders solve 4 problem sets related to an introduction to statistics. First, they find the range of each set of data. Then, students find the median and mode of each set of data. In addition, they...
Other popular searches
- Mean Median Mode Range
- Mean, Median, Mode Range
- Mean, Median, Mode, Range
- Mean Median Mode and Range
- Range, Mean, Median, Mode
- Mean, Median, Mode, and Range
- Mean, Median, Mode and Range


