University of Pennsylvania
Canaan and Ancient Israel
Planning for your next activity on ancient Israel, but not sure where to start? Check out this assortment of activities to help get the ball rolling. It includes a range of ideas on topics, such as Greek and Egyptian mythology,...
Curated OER
Central Tendency
Fifth graders compare and contrast different sets of data on the basis of measures of central tendency.
Curated OER
An Introduction to Elementary Statistics
Students explain and appreciate the use of statistics in everyday life. They define basic terms used in statistics and compute simple measures of central tendency.
Curated OER
Holly Leaves
Sixth graders analyze mathematics by participating in a botany activity. In this holly lesson, 6th graders identify if all holly leaves have the same amount of prickles by conducting a math survey. Students analyze many leaves and...
Curated OER
Using Averages to Create Graphs Through Excel
Sixth graders create and use a spreadsheet to make graphs which will be used to analyze Progress Report and Final Report Card grades. They practice finding the mean, median, mode, and range of a data set. Students also incorporate column...
Curated OER
Data Analysis, Probability, and Discrete Math: Lesson 5
Eighth graders are read the material that is printed in boldface type inside the boxes. Information in regular type inside the boxes and all information outside the boxes should not be read to them. They then find the mean, median,...
Curated OER
Measures of Central Tendency
Students analyze data using central tendencies. In this statistics lesson, students collect and analyze data using the mean, median and mode. They create a power point representing the different measures of central tendency.
Curated OER
Central Tendency
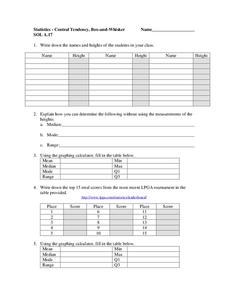
For this central tendency worksheet, students solve and complete 10 different problems that include measures of central tendency. First, they write down the names and heights of students in their class. Then, students explain how they...
Curated OER
Tech Algebra: A Statistics Study
Young scholars use the internet to gather a minimum of thirty pieces of data. Students create box and whisker graphs, and stem and leaf plots from the information. They calculate mean, median, mode, and range. Young scholars write a...
Curated OER
Box Plots
Students review the concept of median, explore how to calculate quartiles for any size data set and experience how to build a box plot.
Inside Mathematics
Suzi's Company
The mean might not always be the best representation of the average. The assessment task has individuals determine the measures of center for the salaries of a company. They determine which of the three would be the best representation...
Los Angeles County Office of Education
Assessment For The California Mathematics Standards Grade 6
Test your scholars' knowledge of a multitude of concepts with an assessment aligned to the California math standards. Using the exam, class members show what they know about the four operations, positive and negative numbers, statistics...
NASA
Exploring Data
Bring the sun to your class! Young scholars analyze actual solar wind data in the second lesson of a five-part series. Their analysis includes speed, temperature, and density data.
CK-12 Foundation
Understand and Create Stem-and-Leaf Plots: Stem-and-Leaf Plots
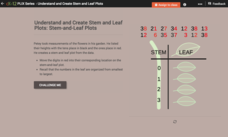
Explore the advantages to using a stem-and-leaf plot using an online lesson. Learners manipulate an animation to create a stem-and-leaf plot. They then calculate statistics for the data using their display. Guiding questions help them...
American Statistical Association
Tell it Like it is!
Scholars apply prior knowledge of statistics to write a conclusion. They summarize using correct academic language and tell the story of the data.
Virginia Department of Education
Exploring Statistics
Collect and analyze data to find out something interesting about classmates. Groups devise a statistical question and collect data from their group members. Individuals then create a display of their data and calculate descriptive...
Curated OER
Describing Data
Your learners will practice many ways of describing data using coordinate algebra in this unit written to address many Common Core State Standards. Simple examples of different ways to organize data are shared and then practice problems...
Bowland
Mystery Tours – Plan Your Tour
Everyone loves a vacation and a set of three activities has groups planning a tour of the U.K. using given distance, time, and price data. They solve a variety of problems related to the trip and produce a report on the success of the trip.
Curated OER
Fall Leaves
In this fall leaves worksheet, students identify the colors of leaves and determine the number they have of each. This worksheet may be used in elementary grades, for color identification and counting purposes. For the middle school...
Curated OER
What Are Your Favorite Apples?
In this tally learning exercise, students take a survey to determine the favorite apple. They write tally marks beside the apple chosen. For elementary students, this learning exercise may be used for counting purposes and to reinforce...
Curated OER
Anatomy of a Virus
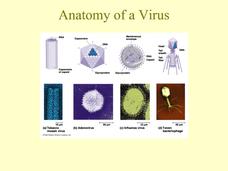
This PowerPoint summarizes details about the virus from the structure and reproduction methods to the different modes of infection. Various viral diseases of animals and plants, viroids, prions and genetic origins of viruses are discussed.
Curated OER
Box Plots
In this statistics worksheet, students analyze problems by finding the mean, median and mode. They also set data by their median, and quartiles. There are 7 questions dealing with 2 different sections.
Curated OER
How Many Animals?
Students use their math skills to develop estimates for the population of several animal species native to the Austrailian rainforest. It is a simulation that researchers at the Center for Rainforest Studies in Australia perform to...
Curated OER
Handling Data: measure of Average
Fifth graders analyze data from a simple table. In this graphing lesson, 5th graders compare distributions. Students recognize that the mean helps them find the formula. Students answer questions on the mean, median, and range.
Other popular searches
- Mean Median Mode Range
- Mean, Median, Mode Range
- Mean, Median, Mode, Range
- Median Mode Range
- Mean Median Mode and Range
- Range, Mean, Median, Mode
- Mean, Median, Mode, and Range
- Median Mode and Range
- Mean, Median, Mode and Range
- Median, Mode, Range


