Curated OER
Solving Linear Equations
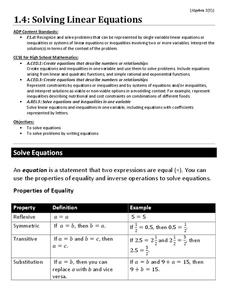
Use this worksheet for practice or review solving linear equations in one variable. Problems range from multiple-step problems involving parentheses and combining like terms, to word problems, to equations with no solution or infinitely...
Mathalicious
Pic Me!
Finally! Math and Instagram have come together to discuss the correlation between likes and followers. High schoolers can't help but want to discover what makes one account more popular than another by developing a line of best fit and...
EngageNY
Polynomial, Rational, and Radical Relationships
This assessment pair goes way beyond simple graphing, factoring and solving polynomial equations, really forcing learners to investigate the math ideas behind the calculations. Short and to-the-point questions build on one another,...
Curated OER
Describing Data
Your learners will practice many ways of describing data using coordinate algebra in this unit written to address many Common Core State Standards. Simple examples of different ways to organize data are shared and then practice problems...
EngageNY
Multiplying and Factoring Polynomial Expressions (part 2)
If you can multiply binomials, you can factor trinomials! This is the premise for a instructional activity on factoring. Pupils look for patterns in the binomials they multiply and apply them in reverse. Examples include leading...
Radford University
Sleep and Teen Obesity: Is there a Correlation?
Does the number of calories you eat affect the total time you sleep? Young mathematicians tackle this question by collecting their own data and making comparisons between others in the class through building scatter plots and regression...
Inside Mathematics
Snakes
Get a line on the snakes. The assessment task requires the class to determine the species of unknown snakes based upon collected data. Individuals analyze two scatter plots and determine the most likely species for five additional data...
Inside Mathematics
Population
Population density, it is not all that it is plotted to be. Pupils analyze a scatter plot of population versus area for some of the states in the US. The class members respond to eight questions about the graph, specific points and...
Curated OER
Roman Bernardo: Solving Linear Equations
Mathematicians use an inquiry method to solve linear equations. In this linear equations instructional activity, students practice solving equations using addition, subtraction, multiplication and division. They solve multi-step...
Curated OER
Hot Wheels
Young scholars observe the action produced by toy cars. In this geometry lesson, students discuss motion and distance as they relate to the movement of a spherical object.They collect data and make conjectures based on their data.
Shodor Education Foundation
An Introduction to Arithmetic and Geometric Sequences
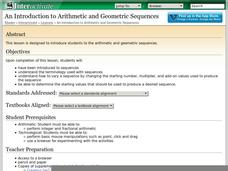
Help your class look for patterns as they create their own arithmetic and geometric sequences. Engage learners with an introductory discussion on sequences and use the applet to let them explore how sequences are formed. Teachers might...
Curated OER
Maximize It!
Students design a rectangular box without a lid that has the largest possible volume using the supplied sheet of centimeter graph paper. They work in groups to construct different size boxes to determine the largest possible volume and...
Curated OER
Slope & Rate of Change
This short handout addresses the concept of slope in two different ways: geometrically and analytically. Start with a brief description of slope, then use graphical representations to compare positive vs. negative slope and zero vs....
Curated OER
Reflections
Learners explore reflection of polygons on a coordinate plane. They examine the relationships that exist between corresponding points and sides.
Shodor Education Foundation
Graphing and the Coordinate Plane
Ready to introduce your class to the coordinate plane? This website includes a detailed lesson plan that includes two interactive games to help learners practice graphing ordered pairs. The scripted discussion is a little cheesy and a...
Curated OER
An Introduction to Sequences
Fourth graders are introduced to arithmetic and geometric sequences. In this mathematics lesson, 4th graders produce a variety of sequences by varying the starting number, multiplier, and the add-on number.
Curated OER
Credit Cards and Compound Interests-Exponential Growth
Eleventh graders investigate the way credit cards work when collecting interest. In this algebra lesson, 11th graders investigate the growth of interest exponentially when using a credit card. They calculate what the cheapest rate is to...
Curated OER
The Truth About Triangles and Squares
Fourth graders investigate the patterns associated with both triangular and square numbers. They use counters as manipulatives to depict the numbers as needed but focus on problem solving using mental math techniques.
Curated OER
Means of Growth
Students collect and graph data. In this statistics lesson plan, students analyze their plotted data using a scatter plot. They identify lines as having positive, negative or no correlation.
Curated OER
The Swinging Pendulum
Students observe a pendulum and graph their observation. In this algebra lesson, students use the TI calcualtor to graph the motion the pendulum makes. They analyze the graph and make predictions.
Curated OER
Recognizing Patterns
Students explore the concept of patterns. In this patterns lesson, students use applets to manipulate tessellations. Students predict the next number in a sequence by recognizing patterns.
Curated OER
Graphing and the Coordinate Plane
Students gain practice reading coordinates and plotting points by participating in the Coordinates! Game. They demonstrate and test their skills with graph paper and the Maze Game.
Alabama Learning Exchange
The Composition of Seawater
Students explore the concept of finding the composition of seawater. In this finding the composition of seawater instructional activity, students make a saturated salt water solution. Students discuss why there is variation in ocean...
Curated OER
The Demise of Copper's Trading Power
Eighth graders evaluate statistical equations. They examine data from archaeologists at Jamestown, complete statistical equations using the sets of data, and graph the results.


