NASA
Lights on the International Space Station
Groups explore illumination with NASA's Lighting Environment Test Facility (LETF) as a context. Using the TI-Nspire app, groups determine the lux equation that models their simulation. They then use the lux equation to...
Curated OER
Star Count
Fourth graders explore the night sky with their star counter. They to determine the types of stars and the number that can be seen from their local area and share their data via the Internet. They participate in NASA online projects.
Curated OER
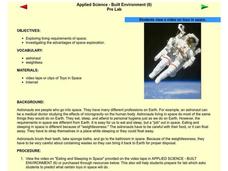
Living in Space
Young scholars explore space science by viewing a video in class. In this astronaut lesson, students identify the living habits of astronauts by researching the NASA website and observing a space science video in class. Young scholars...
Alabama Learning Exchange
Can Plants Be Grown in Space?
Students investigate finding a solution to growing plants in space. They define key vocabulary terms, conduct an experiment growing plants, explore various websites, and participate in a live video conference with NASA regarding the...
Curated OER
Designing a Space Station
Students view pictures of the space station and discuss their feelings about living in a space station. They discuss the materials needed to build a space station and its various needs for operation. They read the NASA contest rules...
Curated OER
Introduction To Orbital Mechanics
Students use NASA drawings to build a model satellite for a specific mission. They design a set of drawings for their satellite showing its subsystems as well.
Curated OER
Get a Leg Up
Traveling through space is an amazing experience, but it definitely takes a toll on the body. After reading an article and watching a brief video, learners perform an experiment that simulates the effects of zero gravity on the...
National Wildlife Federation
Stifling, Oppressive, Sweltering, Oh My!
Looking for a hot date? Pick any day in August, statistically the hottest month in the United States. The 15th lesson in the series of 21 instructs pupils to investigate the August 2007 heat wave through NASA data, daily temperature...
Curated OER
Mission Meals
Students calculate the basal metabolic needs of astronauts. In this food preservation lesson, students take on the role of a NASA nutritionist to create a diet for an astronaut. Students create a meal plan for a week to maintain enough...
Curated OER
Creating Climographs
Students use satellite data to compare precipitation and surface temperatures on different islands. In this satellite lesson students create graphs and explain the differences between weather and climate.
Curated OER
Hurricane Research
Students examine the factors that influence hurricanes to develop. In this hurricane lesson students research atmospheric trends that affect hurricanes and create a summary.
NASA
Heavy Lifting
Accept NASA's challenge to design heavy lifting vehicles. Groups of three design balloon-powered rockets to carry as much payload to the ceiling as possible. The teams are encouraged to launch several times while making...
NASA
Cosmic Times 2019
NASA is planning a journey to Mars, and current scholars could very well be a part of a future mission. During the unit, pupils research the advances in space exploration and knowledge about the universe. Then they work in groups to...
NASA
Using Models in Climate Change Research
Explore models through the relevant lens of climate change! Investigators watch a video about using models and their application for evaluating temperature data and climate change. Scientists read an article on climate change and answer...
NASA
Data Literacy Cube: Global Atmospheric Temperature Anomaly Data
Evaluate global temperature anomalies using real-world data from NASA! Climatologists analyze a data set using a literacy cube and differentiated question sheets. Team members evaluate global temperature anomaly data with basic...
NASA
Comparing Temperature and Solar Radiation for Common Latitudes
There's snow much to learn! Excited individuals use real-world data to discover how latitude affects the odds of a snow day. Scientists compare latitude, solar radiation, and temperature using NASA data for several locations....
NASA
Cloudy vs. Clear - Graphs
Explore the link between solar energy and cloud cover using real data from NASA from China! Future climatologists analyze and interpret graphs of solar energy on clear and cloudy days using a literacy cube. Investigators draw conclusions...
NASA
Behavior Over Time: Analyzing Seasonal Soil and Air Properties
Moisture can affect air temperatures and so much more! An analysis of NASA soil moisture data allows pupils to make connections between climate and weather features. They first review general data and then select a specific location to...
Curated OER
Snow Cover By Latitude
Students create graphs comparing the amount of snow cover along selected latitudes using data sets from a NASA website. They create a spreadsheet and a bar graph on the computer, and analyze the data.
Curated OER
Seasons and Cloud Cover, Are They Related?
Students use NASA satellite data to see cloud cover over Africa. In this seasons lesson students access data and import it into Excel.
Curated OER
A Comparison of Land and Water Temperature
Learners examine NASA satellite observations of surface temperature and investigate the seasonal changes of land and water temperature.
Curated OER
Cyanobacteria Races: Cyanobacteria Motility Experiment for a Classroom
Students experiment to determine the effect of light on cyanobacteria movement. They graph the data of the experiment for further analysis. They watch a time-lapse video of cyanobacteria motility at a NASA website.
Curated OER
Aerosol Lesson: Language Arts
Students construct a model of a volcano. They read "NASA Facts Atmospheric Aerosols" and discuss the impacts of volcanic eruptions. They write informative essays about how aerosols impact the Earth.
Curated OER
Using My Nasa Data To Determine Volcanic Activity
Students use NASA satellite data of optical depth as a tool to determine volcanic activity on Reunion Island during 2000-2001. They access the data and utilize Excel to create a graph that has optical depth as a function of time for the...
Other popular searches
- Nasal Passages
- About Nasa
- Nasa Planets
- Nasa Robots
- Nasa Lesson Math
- Nasa Aircraft
- Nasa Materials
- History of Nasa
- Nasa Lesson Plans
- Nasa Web Based Textbook
- Nasa Aurora
- Contributions of Nasa


