EngageNY
Understanding Box Plots
Scholars apply the concepts of box plots and dot plots to summarize and describe data distributions. They use the data displays to compare sets of data and determine numerical summaries.
EngageNY
Writing and Evaluating Expressions—Multiplication and Division
Don't table the resource on writing expressions for relationships in tables. Scholars investigate relationships between variables and write algebraic expressions involving multiplication and division. These expressions help solve...
EngageNY
Creating a Histogram
Display data over a larger interval. The fourth segment in a 22-part unit introduces histograms and plotting data within intervals to the class. Pupils create frequency tables with predefined intervals to build histograms. They describe...
EngageNY
Describing a Distribution Displayed in a Histogram
The shape of the histogram is also relative. Learners calculate relative frequencies from frequency tables and create relative frequency histograms. The scholars compare the histograms made from frequencies to those made from relative...
Curated OER
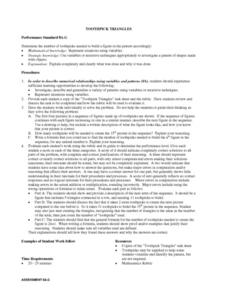
Toothpick Triangles
Learners draw a chart (included in the lesson) to use with their investigation. They review terminology of triangles and receive toothpicks to use in the lesson. Beginning with three toothpicks, students form a triangle. They complete...
Curated OER
Algebra: Coordinates and Straight Line Graphs
Young mathematicians review what they have previously learned about coordinates and straight line graphs. Then, they access an interactive component within the lesson to gain more practice with this skill. Additionally, there are two...
EngageNY
Chance Experiments
Class members are introduced to probability using terms such as impossible, unlikely, likely, and certain. Numbers between zero and one are associated with the descriptions of probability. Pupils find the likelihood of chance experiments...
BBC
Simple Addition and Subtraction
Here is a wonderful lesson designed for young mathematicians. In it, they employ simple addition and subtraction strategies in order to solve word problems. There are some excellent activity sheets embedded in the plan to make the...
Curated OER
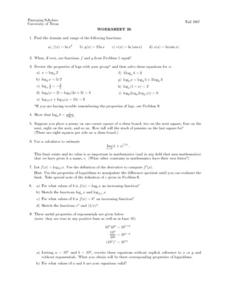
Worksheet 26 - Functions & Logarithms
In this function and logarithms worksheet, students find the domain and range of functions, use the properties of logs to solve equations. This one-page worksheet contains nine multi-step problems.
Virginia Department of Education
Growing Patterns and Sequences
Learners explore, discover, compare, and contrast arithmetic and geometric sequences in this collaborative, hands-on activity. They build and analyze growing patterns to distinguish which kind of sequence is represented by a set of data...
Curated OER
Tour of the Solar System
Learners engage in science, math, and language activities as they do research on the components of the solar system. The class begins with some anticipatory activities and discussions before it is divided into small groups to conduct...
Curated OER
Gathering Data to Problem Solve
Students, while using reading and writing strategies (subheads, prediction, skim, details, drawing inferences, etc,), solve math problems that involve gathering and representing data (addition, subtraction, multiplication). They practice...
Curated OER
The football and Braking Distance; Model Data with Quadratic Functions
Learners use the quadratic formula to solve application problems. The first problem relates to the path of a football thrown from the top of the bleachers. Students compute the time it will take the football to reach certain heights. In...
Curated OER
Conditional Statements
Students are introduced to the topic of proofs in Geometry. During a PowerPoint presentation, they take notes on indirect proofs and have groups of students write a true statement. They are assessed on the statement and how well they...
Curated OER
Escher-Esque Tessellations
Middle and high schoolers participate in a seven-part lesson creating Escher-Esque tessellations. They demonstrate their knowledge of geometric transformations after viewing a PowerPoint presentation, conducting Internet research, and...
SaveandInvest.org
Introduction to Earning Interest: Middle School
Does your bank pay you for allowing them to hold your money? Class members research three different ways they can earn money using money already in the bank. Topics include certificates of deposit, statement savings accounts, and...
Curated OER
Galluping Away
Pupils use Gallop Poll results to explore causes and effects of the concerns of Americans in the past. They administer a similar poll and consider what Americans in their community view as the most pressing problems in the United States...
EngageNY
The Power of Exponential Growth
How do you make a penny grow to $5,000 in just 15 days? Use the examples in this lesson plan to explore the concept of exponential growth and its comparison to linear models. Pupils come to understand that exponential growth eventually...
Curated OER
All Choked Up By Smoking Statistics
Scholars use the article "More College Learners Are Smoking, Study Says" as a springboard for discussion on the reasons why people smoke cigarettes. They investigate different methods of graphing statistics by using the data provided in...
Curated OER
Opinion Poll-arities
Learners explore the mathematics behind opinion polls, as well as provides a framework for interpreting trends in opinion poll graphics.
Curated OER
Lab 2: Drag Racing
In this instructional activity, students, Analyze the relationship between velocity and acceleration * Calculate an object's average acceleration * Collect data and interpret it* Create and analyze a graph showing acceleration.Students...
West Contra Costa Unified School District
Solving Equations with Variables on Both Sides
So many different ways to solve equations, so little time! Scholars learn how to solve equations with variables on both sides by using several different methods. They apply bar models, decomposition, and traditional algebraic methods to...
Curated OER
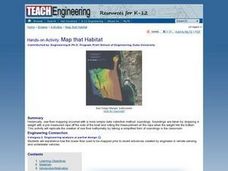
Map that Habitat
Students participate in an activity that replicates the creation of sea floor bathymetry by taking a simplified form of soundings in the classroom. They discuss sea floor mapping technologies, sonar, soundings, and remote sensing,...
West Contra Costa Unified School District
Introduction to Solving Linear Inequalities in One Variable
Life isn't fair ... like inequalities. After first reviewing inequality symbols and how to read inequality statements, learners discover how to solve one-step inequalities and graph their solution sets.


