Curated OER
Study Guide: Rational Numbers
In this rational numbers worksheet, students solve and complete 8 different problems that include applying the comparison property and density property for rational numbers. First, they replace each blank with the correct symbol to make...
Curated OER
Introduction to Graphs
Students poll classmates to gather information for a graph. They identify three types of graphs (bar, line, table). Students create each type of graph using data gathered from classmates.
Curated OER
Scientific Observation of Force and Acceleration on an Object
In this force and acceleration worksheet, 8th graders answer ten questions based on two graphs. The first graph is a scatter plot, the second is a line graph.
Curated OER
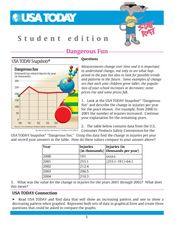
Dangerous Fun
In this line graph worksheet, students analyze the data on a graph about toy-related injuries by year. Students solve 5 problems in which the change in injuries per year is calculated and recorded on a table.
Curated OER
Inequalities are Everywhere
In this Algebra I activity, 9th graders work with a family member to graph inequalities on a number line. The two page activity contains five questions. Answers are included.
Curated OER
Parallel Lines and Properties of Slope
Students define functions to be graphed using the Y=key. They demonstrate how to set up a standard viewing screen using Zoom 6. They discuss and explore mathematical questions on a worksheet.
Curated OER
Solving Linear Systems by Graphing
A worksheet that offers four problems to practice solving simultaneous equations by graphing. Equations are presented in slope-intercept form or standard form. Problems include two with unique solutions, one with no solution, and one...
Curated OER
Challenge: Graphing Functions
Here is a functions worksheet in which learners solve functions containing variables, graph the coordinates, and answer two questions about it. They complete 14 functions.
Curated OER
Graphing Quadratic Equations
Review the form of a quadratic function, and the parabola it creates. Continue on with the whole group to work through a mini-lab, practicing how to graph quadratic equations with one variable. The goal of this lesson is for the group...
Curated OER
Graphing X, Y, Z
Seventh graders explore how proportion controls the image of a drawing. They examine a coordinate plane and discuss plotting. Student experiment drawing an object one size, and then drawing an identical object on a different scale.
Curated OER
Write an Equation of a Line Given Slope and a Point
Ninth graders are investigating slope of a line. The line is plotted using the slope and points on a line. They also write an equation given the right information. The use of a PowerPoint is part of the presentation.
Curated OER
Treasure Hunt: Coordinate Graphing
Two of the best words any one can hear– treasure hunt! Your class will be excited to practice graphing on a coordinate grraph as they identify and write coordinates for landmarks they see on a treasure map. They trace their route to the...
Curated OER
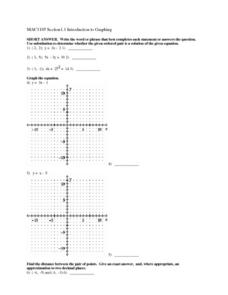
Introduction to Graphing
In this graphing worksheet, students graph linear equations on a coordinate plane. Students identify the slope and y-intercept of each problem, find the midpoint of a line, and the distance between given points. Given an equation,...
Curated OER
Upwelling - Cold One Day, Warm Another?
Discuss with your oceanographers what forces cause nearshore upwelling and downwelling. Display a line of wind vectors alongside a graph of the temperatures so that they can discover whether or not they are related. Discussion questions...
Curated OER
Line Graph
In this math worksheet, learners look for the data to fill the line graph. They plot the data using the x and y axis to represent the correct categories.
Illustrative Mathematics
Coffee by the Pound
This is a great exercise in graphing proportional quantities to interpret the unit rate as the slope of a graph. It is not easy for learners to understand what a unit rate is. When it is presented as the slope of a linear line graph,...
Curated OER
Unit II: Worksheet 1 - Velocity
Beginning physics scholars interpret two graphs depicting position versus time. For each graph, there is a series of questions to answer. The exercise is basic, but beneficial. Consider using it as an assessment of understanding after...
Utah Education Network (UEN)
Mathematics: Growing Patterns
Learners graph growing patterns using ordered pairs on a coordinate grid. They read The Fly on the Ceiling, a Math Myth.
Curated OER
Data Analysis Challenge
In this data analysis worksheet, young scholars work with a partner to collect information for a survey. The information is then compiled into a graph. Students must indicate their survey question, the target audience, predict the...
Curated OER
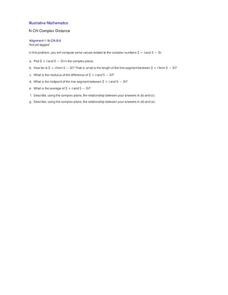
Complex Distance
Have learners graph complex numbers to gain a visual and mathematical understanding of the distance and the midpoint between two complex numbers. This lesson is short, but to the point, and addresses an important complex number concept....
Mathematics Assessment Project
Middle School Mathematics Test 3
Real-life mathematics is not as simple as repeating a set of steps; pupils must mentally go through a process to come to their conclusions. Teach learners to read, analyze, and create a plan for solving a problem situation. The provided...
Illustrative Mathematics
Find the Change
This exercise is an opportunity for algebra learners to understand the connection between the slope of a line and points found on the line. Use similar triangles to explain why slope m is the same between any two points. Discuss with the...
National Nanotechnology Infrastructure Network
Lines on Paper - Laser Box
See what you cannot see by getting a little creative. An intriguing lesson has learners use lasers to explore X-ray diffraction. Given a box with unknown structures, they shine a laser through the box and interpret the results....
Statistics Education Web
Saga of Survival (Using Data about Donner Party to Illustrate Descriptive Statistics)
What did gender have to do with the survival rates of the Donner Party? Using comparative box plots, classes compare the ages of the survivors and nonsurvivors. Using the same method, individuals make conclusions about the gender and...


