Balanced Assessment
Red Dots, Blue Dots
Count the connections between dots. Young mathematicians come up with a method to determine the number of connections between pairs of dots. The assessment leads the class to determine the connections they can make when groups are...
MARS, Shell Center, University of Nottingham
Defining Regions Using Inequalities
Your young graphers will collaboratively play their way to a better understanding of the solution set produced by the combining of inequalities. Cooperation and communication are emphasized by the teacher asking questions to guide the...
Houghton Mifflin Harcourt
Nature Walk: English Language Development Lessons (Theme 2)
Walking in nature is the theme of a unit designed to support English language development lessons. Scholars look, write, speak, and move to explore topics such as camping, woodland animals, instruments,...
Mathematics Vision Project
Equations and Inequalities
Help learners get their facts in line to build and solve complicated linear equations and inequalities. Pupils build upon their knowledge of solving basic equations and inequalities to solve more complex ones. Individuals work with...
Curated OER
Sunshine Math 3
In this word problems instructional activity, learners read and problem solve nine mathematical word problems involving grids, measurement, compensation and angles.
Mathwire
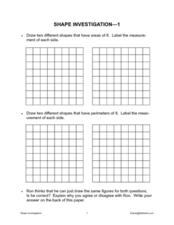
Shape Investigation: Area and Perimeter
Does a shape's perimeter always match its area? Learners approach this and other claims in this shape investigation worksheet. Using blank grids, they draw various shapes based on required perimeter and area measurements, labelling the...
PBL Pathways
Doctors and Nurses
How many nurses does it take to support one doctor? A project-based activity asks learners to analyze state data to answer this question. Classes create polynomial functions from the data of doctors and nurses over a seven-year...
Curated OER
Getting Out of Line
Students explore basic connections between graphs, tables, and symbolic representations for lines, parabolas, inverse models, and exponential models. One of the primary goals of this lesson is to help students begin to recognize patterns...
Curated OER
Slopes of Lines
Students examine a graph and relate it to the real world situation it depicts. They investigate changes in an equation and the appearance of a line. They investigate the connection between the graph of a situation and the meaning of the...
Curated OER
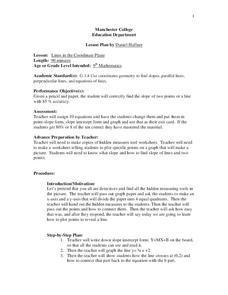
Lines in the Coordinate Plane
Students graph lines in a coordinate plane. In this geometry lesson, students graph lines on a coordinate plane, and identify the slope. They classify the lines as parallel or perpendicular and write an equation of a given line.
Curated OER
Position and Velocity vs. Time Graphs
In this position and velocity worksheet, students sketch graphs of position vs. velocity and position vs. time for 6 problems given different scenarios. They label their graphs with given positions, velocities and times.
Curated OER
The Slope of a Line
In this slope learning exercise, students examine graph and determine the slope of a line. They determine coordinates of a point to make a true statement. Students identify the dependent variable and the independent...
Curated OER
Lines of Slope
In this lines of slope worksheet, 9th graders solve and complete 40 various types of problems. First, they find the equation of the lines described and write in slope-intercept form. Then, students graph each equation. They also find the...
Curated OER
Graphs
In this algebra worksheet, learners solve linear equations through graphing and quadratic equations through factoring. There are 4 questions dealing with systems of equations.
Curated OER
Hassan's Pictures - Linear Programming and Profit Lines
Students graph systems of linear inequalities. In this linear programming and profit lesson, students explore linear programming problems. They graph a feasible region in a linear programming problem and identify the profit lines. ...
Curated OER
Straight Line Motion in Two Parts
Students describe and quantify the motion of toy cars. In this motion lesson, students observe a battery powered toy car on a flat surface and a standard toy car on a sloped surface. They write their observations, measure average speeds,...
Curated OER
Solve Linear Systems of Equations: Graphing, Substitution, and Elimination
In this system of linear equations worksheet, students solve by using graphing, substitution, and elimination. There are 44 problems.
Curated OER
Graphing Speed; Slope
For this graphing speed worksheet, students find the slope in a position vs. time graph to be the speed. They are given example graphs of position vs. time to show the changes in slope reflect the changes in speed. Students match terms...
Curated OER
Graphing
Students collect data and graph their results, then analyze the graphs. For this geometry lesson, students examine slopes and their graphs and discuss the relationship between the lines and the slopes.
Curated OER
Graphing Speed
In this graphing learning exercise, students read about independent and dependant variables and learn how to determine speed from the slope of a position vs. time graph. This learning exercise has 4 matching, 17 fill in the blank, and 2...
Texas Instruments
A Tale of Two Lines
Students graph systems of equation. In this calculus lesson, students graph their lines on a TI calculator. They identify the point of intersection and the type of solution.
Curated OER
Graphing Solutions
In this graphing solutions worksheet, 9th graders solve 13 various types of problems. First, they find the solution of each systems by graphing on the coordinate plane provided. Then, students solve each systems of equations...
Curated OER
Graphing Polynomials
Learners graph polynomial equations using different methods. In this algebra lesson, students identify the different ways the x and y values relate in a graph. They solve for x by finding the zero's of the polynomials.
Curated OER
Graphing the Past Using Today's Technology
Eighth graders research statistical data regarding their current social studies unit. They write questions about the measures of central tendency, collect and analyze the data, insert the data into a spreadsheet, and generate graphs.


