Computer Science Unplugged
Battleships—Searching Algorithms
How does a computer perform a search in order to find data? The lesson begins with a demonstration on finding one number out of 15. Pairs then play three games of Battleship by using different search techniques. The lesson plan finishes...
5280 Math
Interesting Times
Gain a little interest in functions with a real-life task. Young scholars analyze home loan data with a geometric sequence and series. They use the models to make predictions about the total loan payments at certain intervals in a useful...
Houghton Mifflin Harcourt
Divide 2-Digit Numbers
Calling all cars! It's time to solve some division problems! A chart of special police units and the number of officers in each provides the data for six word problems. Young recruits use their division skills to solve them. Note that...
Computer Science Unplugged
Codes in a Song—Modems
Let's listen to some codes. To understand how a modem sends binary numbers over a phone line, class member listen to the codes included in the provided mp3 files, translates the tones to binary numbers and then convert the binary numbers...
Curated OER
Learn How to Graph
Students examine various types of charts and discover how to construct a line graph. Using graph paper, they construct a graph displaying weight loss over a five-year period. They draw copnclusions from the completed graphs.
Curated OER
Microsoft Access Lesson Plan
Third graders read children's literature during the school year and compile a list of books and genres in an Access database. They print out a report of all the different books and genres of they read over the whole school year.
Curated OER
Creating Line Graphs
Students draw line graphs. In this math lesson plan, students interpret minimum wage data and graph the data in a line graph. Students predict the next minimum wage and figure the earnings for a 40 hour work week for someone earning the...
Curated OER
The Vietnam Lotteries
In this probability and statistics worksheet, students examine the “fairness” to the Vietnam draft lottery system by constructing box plots of each of the twelve months using data provided. The three page worksheet contains one problem...
Curated OER
Hurricanes and Climate
Students investigate maps and data to learn about the connections between hurricanes and climate. In this exploratory lesson students describe and graph the 6 regions where hurricanes happen and discuss how hurricanes have changed over...
Curated OER
Bar Graphs
Seventh graders visually represent and analyze data using a frequency table. They recognize what values in a data set are bigger by looking at a bar graph and answer questions about certain bar graphs and what they represent. Students...
Curated OER
Where Did We Go on Holiday This Year?
In this differentiated whole-group activity worksheet, students list all the places they visited over the summer, record the places on a flip chart, calculate the distances on a road map and graph the data they collect.
Math Drills
Valentine's Day Ordering and Comparing (B)
Discover this Valentine's Day-themed worksheet where young mathematicians answer word problems using data tables.
National Security Agency
Going Green with Graphs
In this unit designed for second graders, youngsters are introduced to conducting surveys and creating tally charts based on the data they gather. Students then construct bar graphs, and observe the relationships between the two types of...
Yummy Math
Hot Summer. . . Cold Winter
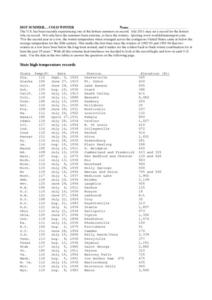
A table of each state's record temperature reports data that middle schoolers can place on a number line for analysis. A written explanation of how to use this tool and the concept of absolute value are also included. Nine questions are...
Curated OER
Correlating Atmospheric Data Lesson Plan
High schoolers make and test hypotheses about atmospheric data collected aboard the NOAA ship Ronald H. Brown research cruise.
Curated OER
Real-life Problems, Money, and Weight
Solve five word problems involving money and weight. After studying the example at the top, which demonstrates how to write out the equation in a word problem, fourth graders work on adding large numbers in money and measurement. Here is...
Curated OER
Higher Order Thinking (H.O.T.) Lesson - BIG E
Fourth graders work with patterns while using large numbers. In this patterning instructional activity, 4th graders go over the definitions of the words: predict, estimate, attendance, increase, and decrease. They complete worksheets in...
Virginia Department of Education
Balancing Act
How many different interpretations of the mean are there? Scholars place numbers on a number line and determine the mean. They interpret the mean as the average value and as the balance point.
Port Jefferson School District
Hurricane Katrina
Young scientists track Hurricane Katrina across the Atlantic Ocean as they learn about these destructive forces of nature. Provided with a table of data tracking the location and conditions of Katrina over a one week span, learners plot...
Curated OER
Valentine's Day Ordering and Comparing (D)
In this math worksheet, students solve 24 problems pertaining to Valentine cards received and given by a child over a 5 year period. Students examine the information charts and answer questions about the data.
Polar Trec
Down to the Deep Virtual Lab
At a depth of 3,000 m in the ocean, the pressure is 300 times that at sea level! In the activity, individuals predict what will happen to Styrofoam cups submerged 3,000 meters into the ocean. They then convert these units to soccer...
Curated OER
Applied Science - Science and Math Pre Lab
Students find Fibonacci sequences. In this applied Science lesson, students solve Fibonacci sequence problems. Students explore the mathematical patterns of objects in nature.
Curated OER
Sharks ~ Taking a Bite Out of the Myth
The first thing to know about this lesson is that the commercial fisheries data for the activity no longer seems to be available. That being said, there are fascinating links to other websites, some about the comparative odds of being...
Teach Engineering
Lighting in My Classroom Survey
How much energy does it take to light a room? Class members calculate the total wattage it takes to light the classroom. Through calculations, responsible scientists determine the cost of energy for the year, then figure out how much...


