Curated OER
Pick A Number
Elementary schoolers find out which month has the most class birthdays (mode) and which birthday represents the middle point of all the birthdays (median). They gather and organize data to find one number that fairly represents the whole...
Willow Tree
Scatterplots and Stem-and-Leaf Plots
Is there a correlation between the number of cats you own and your age? Use a scatter plot to analyze these correlation questions. Learners plot data and look for positive, negative, or no correlation, then create stem-and-leaf plots to...
Curated OER
Organizing Data
In this organizing data learning exercise, 7th graders solve seven different types of problems related to data. They first identify the type of data as categorical, discrete or continuous from the information given. Then, students use...
Curated OER
Veggie Chop and Data Analysis
First graders chop vegetables into fractions. In this fractions lesson, 1st graders cut vegetables, collect data about favorite vegetables and create a bar graph using the information. Students make inferences about the data and record...
Curated OER
Reading Bar Graphs #2
Raise the bar in your third grade class with this learning exercise on bar graphs. Youngsters view three graphs representing three different sets of data, and answer questions based on what they analyze. The first set is completed as an...
US Department of Commerce
Looking at Numbers of Births Using a Line Graph
Was there a baby boom? Using census data, class members take a look at the number of 8-11 year olds and determine their birth years. Scholars create a double line graph to compare the number of births for two states for several years....
Curated OER
Data Collection and Presentation
Students access how to collect, classify and display data involving statistics. The concepts of quantitative, discrete and continuous data is covered in depth within the lesson. They practice with a scenario of James filled with...
EngageNY
Posing Statistical Questions
Is this a statistical question? The opening lesson in a series of 22 introduces the concept of statistical questions. Class members discuss different questions and determine whether they are statistical or not, then they sort the data...
Inside Mathematics
Population
Population density, it is not all that it is plotted to be. Pupils analyze a scatter plot of population versus area for some of the states in the US. The class members respond to eight questions about the graph, specific points and...
Association of American Geographers
Project GeoSTART
Investigate the fascinating, yet terrifying phenomenon of hurricanes from the safety of your classroom using this earth science unit. Focusing on developing young scientists' spacial thinking skills, these lessons engage learners in...
National Wildlife Federation
Quantifying Land Changes Over Time Using Landsat
"Humans have become a geologic agent comparable to erosion and [volcanic] eruptions ..." Paul J. Crutzen, a Nobel Prize-winning atmospheric chemist. Using Landsat imagery, scholars create a grid showing land use type, such as urban,...
Curated OER
Mathemafish Population
It's shark week! In this problem, young mathematically minded marine biologists need to study the fish population by analyzing data over time. The emphasis is on understanding the average rate of change of the population and drawing...
Curated OER
It Has Been Rubbish For Years
Students are presented with the problems of percentages and focus upon numbers in contrast to 100. They calculate problems with money and are engaged with the use of games as a teaching tool. Students also interpret data as presented in...
Curated OER
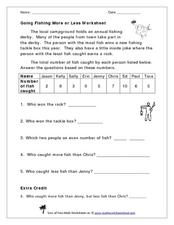
Going Fishing More or Less Worksheet
Take your class on a hypothetical fishing trip! This word problem gives a data set describing how many fish each of the nine contestants in a fishing derby caught. The numbers range from zero to ten. Learners examine the data and answer...
Curated OER
Interpreting Circle Graphs
What does this pie chart mean? Once scholars can analyze a circle graph on a basic level (i.e. "Most people prefer cats"), it's time to delve deeper into it. They examine two graphs here, and are given the total number of participants...
Math Drills
Valentine's Day Ordering and Comparing (A)
Youngsters use a data table to answer questions, in a Valentine's Day-themed learning exercise.
Federal Reserve Bank
FRED in the Classroom: Debt and Deficit
Here is a hands-on activity where your class members will discover different ways to measure the government's financial situation and work to add data and redraw graphs in order to calculate the ratio of gross federal debt held by the...
Federal Reserve Bank
FRED in the Classroom: Measures of Inflation
Don't just tell class members about how to measure inflation, have them experience it firsthand by asking them to work with real data and construct graphs!
Curated OER
Questionnaires and Analysis
Young scholars, review the techniques and different types of data analysis as well as how they are expressed, identify why facts and data are needed in conclusion of a questionnaire. The concepts of qualitative and quantitative data are...
Curated OER
A Picture's Worth a Thousand Words
Students analyze the numbers of male vs female administrators and teachers from their school. In this gender equality lesson plan, students use school yearbooks from the 1950's threw present to count how many male vs. female teachers,...
Math Mammoth
Decimal Problems
In this math activity, students are given tables and story problems with decimal points. Students must use the tables and story problems to find 10 answers about the data.
Inside Mathematics
Snakes
Get a line on the snakes. The assessment task requires the class to determine the species of unknown snakes based upon collected data. Individuals analyze two scatter plots and determine the most likely species for five additional data...
Virginia Department of Education
Weather Patterns and Seasonal Changes
Get your class outside to observe their surroundings with a lesson plan highlighting weather patterns and seasonal changes. First, learners take a weather walk to survey how the weather affects animals, people, plants, and trees during...
Curated OER
American Indian Math
Upper graders examine Native American culture while practicing mathematical concepts related to patterns and estimation. They will use mental math to add/subtract single digit numbers.


