Curriculum Corner
“I Can” Common Core! 1st Grade Math
Any first grader can master the Common Core math standards with this checklist! With each standard rewritten as an affirmative I can statement, children are provide with clear goals to work toward throughout the school year.
Display an...
Curated OER
Species and Specimens: Exploring Local Biodiversity
Learners practice skills essential to all scientific investigation: carefully observing and collecting data. They become field biologists in a series of hands-on activities to collect and identify specimens, and survey and calculate the...
Prince William Network
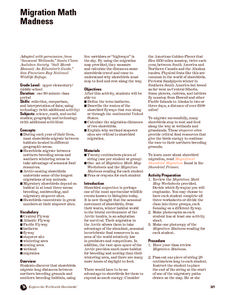
Migration Math Madness
A great way to incorporate math into life science, this lesson has learners measure migratory routes on a map and calculate the actual distance that shorebirds on the routes would cover. Learners compute the distance covered in both...
Curated OER
The Sunspot Cycle-Endings and Beginnings
In this sunspot cycle worksheet, students use a graph of the sunspot numbers from January of 1994 to January of 2008. Students solve 8 problems using the data in the graph to determine the maximum occurrence of sunspots, the minimum...
Curated OER
Midterm 1 Exam: Statistics
In this statistics worksheet, students determine the mean, variance, standard deviation and median of given statistical data. They organize data, create box-and-whisker plots and identify outliers. This nine-page worksheet contains 7...
Curated OER
Discovering Advanced Algebra More Practice Your Skills, Lessons 11.1-11.6
In this six page series of worksheet, students answer short answer questions about a variety of topics. The six topics covered in this packet are: Experimental Design (4 questions), Probability Distributions (3 multiple choice...
Curated OER
Manatee Facts
In this math and science worksheet, learners learn facts about the manatee by reading information on one page. Students answer 5 math word problems using the data they have read.
Curated OER
Musical Genre Pie Charts
In this pie chart worksheet, students transpose musical genre data to the charts and then answer questions about the results.
Curated OER
District Decisions
Young scholars review census data and examine the manner in which reapportionment and redistricting occurs. They, in groups, debate a proposed change in the way congressional districts are drawn and present their debates to the class.
Curated OER
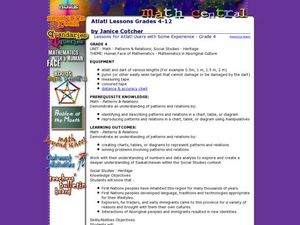
Atlatl Lessons for Grade 4
Fourth graders explore the weapons of the Aboriginal people. In this fourth grade math lesson, 4th graders create charts, tables, or diagrams to represent patterns and relations. Students investigate which dart length has the best...
Curated OER
Louisville's Best Field Day Park
Students create a survey to hand out to determine the best field day park. Using their local area, they select five parks, if possible, that meet the criteria and calculate the distance and estimated time travel. They use this...
Curated OER
Agriculture & Alaska's Economy
Students examine Alaska's agriculture numbers from previous years. They answer questions based on Alaska's production levels.
Curated OER
Where Does It Come From?
Young scholars explore where agricultural commodities used in snack foods are grown. They choose a snack food and locate the top five states that produce the food that the snack is made from.
Curated OER
Tech Algebra: A Statistics Study
Learners use the internet to gather a minimum of thirty pieces of data. Students create box and whisker graphs, and stem and leaf plots from the information. They calculate mean, median, mode, and range. Learners write a summary and...
Curated OER
Plotting with Pennies
Fifth graders use pennies to gather data, organize and order data, graph the data on a stem-and-leaf plot, and evaluate the range, median, and mode of the data.
Curated OER
Stem and Leaf Plots
In this math worksheet, students organize data into stem and leaf plots. They select the correct stem to use to organize the data. Students analyze the data on a given stem and leaf plot.
Curated OER
Locating the Salt Front
Young scholars use Hudson River salinity data to create a line
graph that shows the location of the salt front, and use math
skills to explore how this location varies over time. They use the graph to estimate the location of the salt...
Curated OER
Fire Fighting Crew
Students use the concepts in statistics to make decisions. They calculate the mean, median and mode. They compare one firefighter against another and analyze the data. They share their information with the class.
Curated OER
Baseball Statistics
Learners take an in depth examine baseball record breakers. They calculate statistics, not just for one year, but over whole careers, to compare some famous players and find who was the best all-time home run hitter.
Curated OER
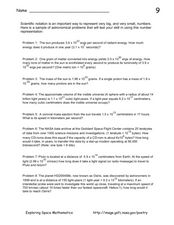
Application of Scientific Notation
In this scientific notation worksheet, learners solve eight problems about the sun, the planets and the universe using very large numbers expressed in scientific notation.
Curated OER
Hurricane Predictions
For this hurricane worksheet, learners analyze and interpret a hurricane graph. They complete 5 short answer questions that follow.
Curated OER
Word Problems That Involve the Mean (II)
In this word problem worksheet, students examine real world problems. They compute the mean, median, and mode of given problems. This one-page worksheet contains 5 multi-step problems. Answers are provided.
Curated OER
Popcorn Geography
Students use kernels to create a "Top Corn-Producing States" map or graph. They read and round off numbers. Students identify on a U.S. outline map the location of corn-growing states. They create a visual (map or graph) illustration...
Noyce Foundation
Pizza Crusts
Enough stuffed crust to go around. Pupils calculate the area and perimeter of a variety of pizza shapes, including rectangular and circular. Individuals design rectangular pizzas with a given area to maximize the amount of crust and do...


