Curated OER
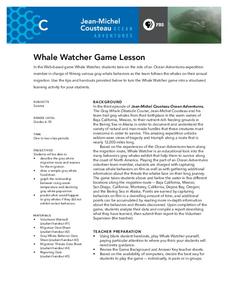
Whale Watcher Game Lesson
Students study the gray whale migration and compare their populations to the increasing ocean temperature. In this whale watcher lesson students draw a food chain.
Polar Trec
Do You See What Icy?
Here is a lesson that kicks off with a question. "How does ice floating on the ocean act as it melts?" As learners investigate this natural phenomenon, they'll discover that it has a lot to do with temperature, salinity, and the effect...
Curated OER
Light Stick Chemistry
In groups of three with the lights off and the shades drawn, investigators place inactivated light sticks, in three beakers: one filled with ice water, another with lukewarm water, and the other with room temperature water. They wait...
Curated OER
Hurricanes As Heat Engines
Students examine sea surface temperatures to see how hurricanes get heat from the oceans surface. In this hurricanes lesson students use the Internet to find data and make line plots.
NOAA
Vertebrates II
Mammals of the ocean unite! Or not. The 20th installment of a 23-part NOAA Enrichment in Marine sciences and Oceanography (NEMO) program investigates how warm-blooded marine mammals survive in water. In the class activity, learners use...
Curated OER
El Niño ~ The Return of El Niño
El Niño sure creates a stir when it comes around! Why not stir up your earth science class with this data analysis activity that examines the temperature and precipitation over the 2002-2003 water year. A tracking chart is provided...
NOAA
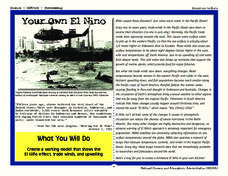
Your Own El Nino
Scholars make a model to discover how the force of trade winds over the Pacific Ocean creates an El Niño. Super scientists observe how the severe weather affects life in water and on land.
Curated OER
Coral Bleaching in the Caribbean
Students practice analyzing images, maps and graphs from Internet-based educational resources. They explore the correlation between sea surface temperature and coral bleaching. Students comprehend that coral reefs are collections of tiny...
Curated OER
Water is Life
Krill is a very small ocean animal that is key to keeping the ocean ecosystem going. The class reviews food webs and chains, learns about the importance of krill, discusses krill anatomy, builds a model of a krill, and then has a...
Chicago Botanic Garden
Climate Change Around the World
You know climate change is happening when you see a bee take off its yellow jacket. Part four in a series of five lessons explores all factors affecting climate change: temperature, cloud cover, precipitation, and carbon dioxide. By...
NOAA
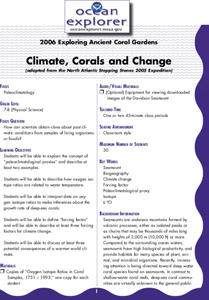
Climate, Corals and Change
Global warming isn't just an issue on land; deep ocean waters are also showing troubling signs. Young scientists learn more about deep water corals and the many recent discoveries researchers have made. Then they examine data related to...
Curated OER
Conductivity - Pass the Buoy and Pepper, Please
Buoys around our coastlines are equipped with sensory devices which monitor temperature, salinity, and water pressure. Emerging earth scientists examine some of this data and relate salinity to the electrical conductivity of the surface...
Chicago Botanic Garden
Climate Change Around the World
It is unknown if cloud cover increases in response to carbon dioxide levels changing, helping climate change slow down, or if cloud cover decreases, allowing Earth to warm faster. Part four in the series of five lessons has classes...
Curated OER
Thermal Expansion and Sea Level Rise
Placing a thermometer and a glass tube into a flask of cold water and sealing it, you can expose it to heat and very visually demonstrate thermal expansion to your earth science class. Follow it with a discussion about how the increasing...
Science Geek
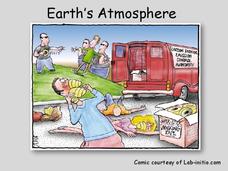
Earth's Atmosphere
Ozone gas absorbs the harmful UV-B rays and helps protect humans. An informative presentation begins with the layers of the earth's atmosphere, the pressure and temperature in each of the layers, the ozone layer, the ozone cycle, and the...
LABScI
Freezing Point Depression: Why Don’t Oceans Freeze?
Can you go ice fishing in the ocean? Learners examine the freezing point of different saltwater solutions. Each solution has a different concentration of salt. By comparing the freezing points graphically, they make conclusions about...
NOAA
Biological Oceanographic Investigations – Signals from the Deep
The Deepwater Horizon oil spill directly impacted an area of the Gulf of Mexico the size of Oklahoma. A marine biology instructional activity looks at the impact of an oil spill on the deeper parts of the ocean. Scholars download actual...
Curated OER
Water in Earth's Hydrosphere
Environmentalists test stream water for temperature, pH, and turbidity. Each group shares their information and then the class makes an overall evaluation of the water quality. A slide show sets the backdrop for the teaching portion and...
Curated OER
Major Ocean Surface Currents
High schoolers investigate wind driven surface currents and prevailing winds by playing a card game. The cards are sorted by north or south and Atlantic or Pacific. They then predict where the two currents are found and what their...
Curated OER
Estuarine Currents
Students explore an estuarine system to gather data on density driven currents. This type of current is contrasted with temperature and wind driven currents.
Curated OER
The Hunt for Red October
Ninth graders identify and apply some of the vocabulary used in Science concerning the Sea Perch project. They view a video of The Hunt for Red October, and students make a comparative study of the translation of the printed work onto...
Curated OER
La Polynesie Francaise
Students use the internet to research the French Polynesian Islands in the Pacific Ocean. For each website, they scan the information and list five French words they do not know the meaning. They complete a worksheet to discover the...
Curated OER
Coral Bleaching
Learners examine the relationship between corals and zooxanthellae, identify stresses to corals, and explain coral bleaching. For this sea life lesson students predict the effects of increased temperatures on coral reefs.
Curated OER
The Oceanographic Yo-Yo
Students examine how oceanographers use chemical and physical parameters of seawater to locate hydrothermal vents. In this ocean lesson plan students complete an activity and worksheets.


