Curated OER
Get a Half Life!: Student Worksheet
Upper elementary or middle schoolers will explore non-linear functions, graphing, and the curve of best fit through real-life data collection and trial analysis. They explore the concept of half-life and radioactive decay using M&Ms,...
Curated OER
Writing Equations
In this writing equations worksheet, 9th graders solve and complete 20 different problems that include writing an equation and finding a solution for each problem. First, they read the problem through and write an equation that best...
Curated OER
Four-Corners Debate
Use this two page handout to establish the rules for class debate. The four-corners method of debate is one that provides a safe way for learners to engage in a discussion or debate over potentially heated or controversial topics. The...
Gatsby Charitable Foundation
Four Activities Using Straight Line Graphs
This math packet includes four different activities which puts linear equations and line of best fit in the context of real world applications. Each activity uses a different linear math modeling equation and asks the learners to...
Curated OER
Influence and Outliers
Using the TI-Nspire calculator, statisicians identify outliers and their effect on the least-squares regression line. In finding the line of best fit, they determine what points will affect the least squares regressions and what points...
Curated OER
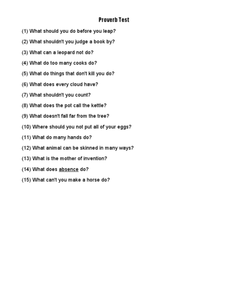
Proverb Test
Use this entertaining worksheet in your class after a lesson on proverbs or as a fun activity after a test. Students read each question and think of the proverb or expression that best fits the description. Have them work in teams or...
Curated OER
Mathematical Modeling
Study various types of mathematical models in this math instructional activity. Learners calculate the slope to determine the risk in a situation described. They respond to a number of questions and analyze their statistical data. Then,...
Curated OER
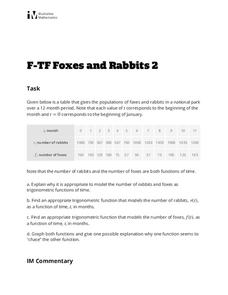
Foxes and Rabbits 2
Explore the relationship between the population of foxes and rabbits in a national park using trigonometric models. Plot data and find the appropriate trigonometric functions. Two questions require interpretation and explanation of...
Curated OER
In the Billions and Linear Modeling
Your learners analyze population data to discern if it best fits a linear scenario. The idea of change by equal differences over equal intervals is enforced in this real-life task.
Curated OER
Affixes and Roots
Here is a skills practice sheet that instructs fourth graders to form words using affixes and root words. After reading 16 clues, individuals match an affix to a root word in order to create the word that best fits the clue.
PBL Pathways
Do Homework?
To complete homework or not to complete homework ... that is the question. Decide whether it makes a difference on finals by doing homework. Individuals create a scatter plot and find a line of best fit for data on the percent of...
EngageNY
More Division Stories
Don't part with a resource on partitive division. Continuing along the lines of the previous lesson, pupils create stories for division problems, this time for partitive division problems. Trying out different situations and units allows...
Physics Classroom
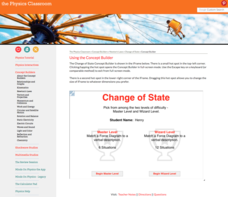
Change of State
Free-body diagrams display all forces acting on an object, helping scientists represent Newton's Laws of Motion. Scholars read a short description of motion and view the free-body diagram to begin the installment of a larger series on...
Serendip
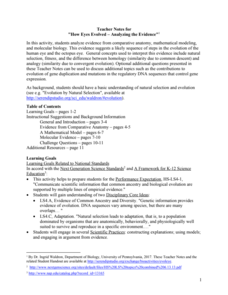
How Eyes Evolved – Analyzing the Evidence
Octopodes existed for hundreds of thousands of years before humans, yet our eyes share many similarities. Scholars analyze the evidence to determine if the evolution of eyes best fits a homology or analogy model. They discuss the issue...
Radford University
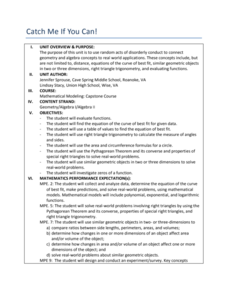
Catch Me If You Can!
Crime doesn't pay, but everyone can learn from it. Learners consider different situations involving mischief at a school, such as stink bombs and rockets, and analyze them using mathematics. They must apply trigonometry, quadratic...
Radford University
Are You Faster than Bacteria?
Just how fast does bacteria grow? Over the course of three lessons, pupils investigate exponential growth with the use of bacteria growth. During the lesson, bacteria from a cell phone is grown to make a connection to real life. Using...
Radford University
Real World Data
Make math class feel more real by using real-world data. Scholars research or collect data on several different topics, such as nutrition, the motion of moving objects, cooling curves, and daylight hours. They create scatter plots using...
Radford University
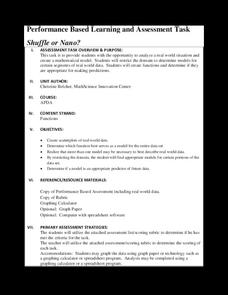
Shuffle or Nano?
Mix up your teaching playlist with a performance-based assessment task. Given iPod sales data for several years, scholars create a scatter plot and perform regression analysis. They determine the best fit curve for different domains.
Radford University
Temperature Math Activity
Warm up to a vacation-finding activity. After choosing a location for a vacation, pupils research the average monthly temperatures for the locality. They create scatter plots of the data and then determine the equations of the best-fit...
Radford University
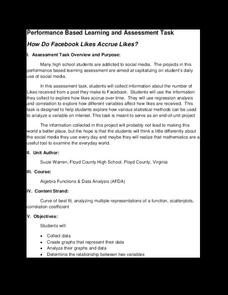
How Do Facebook Likes Accrue Likes?
Finally, a project pupils will instantly like! Young mathematicians collect data on the number of likes they receive for a social media post over time. During the first part of the project, they determine a curve of best fit and...
Radford University
Modeling Statistical Data
Can people predict the number of future divorces? Scholars research and analyze data on the number of divorces and teenage pregnancies in Virginia over time. They use the data to create graphs, determine the best-fit equations, and make...
Teach Engineering
Exploring Variables While Testing and Improving Mint-Mobiles (for High School)
Mint candies are good for more than just one's breath. Using basic materials such as mint candies, straws, index cards, and Popsicle sticks, scholars create race cars that meet a given budget as well as design constraints. They perform...
Health Smart Virginia
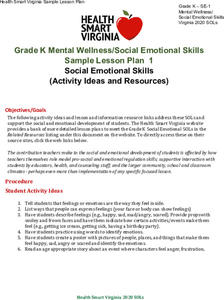
Social Emotional Skills
Nine activities boost social-emotional competencies. Read through the list and choose what best fits the needs of your class. Activities include thoughtful discussions, creating posters, listening to a read-aloud, and more!
Curated OER
Rainbows, Bridges & Weather, Oh My!
Explore how real-world applications can be parabolic in nature and how to find quadratic functions that best fit data. A number of different examples of modeling parabolas are explored including a student scavenger hunt, the exploration...


