Curated OER
What's Your Shoe Size? Linear Regression with MS Excel
Learners collect and analyze data. In this statistics activity, pupils create a liner model of their data and analyze it using central tendencies. They find the linear regression using a spreadsheet.
Curated OER
Data
Students collect data from an experiment they perform. For this data lesson, students use multiple representations to solve practical problems; describe advantages and disadvantages of the use of each representation. Then, they evaluate...
Curated OER
Who's Hiding in Mike's Math Club Picture?
Learners use coordinates to complete the picture. They complete seven groups of coordinates and connect the dots to create an image.
Curated OER
Gradients of Parallel Line Segments
In this gradient worksheet, students draw line segments and determine if they are parallel. They plot points on a coordinate plane and calculate the gradient of each created line. This five-page worksheet contains 8 multi-step problems....
Curated OER
Graphing Functions With 2 Points and From a Graph
Learners plot points on a coordinate plane. They describe, in words, methods for finding the slope of a line. After given a worksheet, students read instructions, draw a Cartesian plane, plot ordered pairs, and graph lines. Papers are...
Curated OER
Graphing Inequalities in Two Variables
This study guide is a great resource to help you present the steps to graphing linear inequalities. Show your class two different ways to graph an inequality and work on a real-world example together. The document could also be easily...
Shodor Education Foundation
Scatter Plot
What is the relationship between two variables? Groups work together to gather data on arm spans and height. Using the interactive, learners plot the bivariate data, labeling the axes and the graph. The resource allows scholars to create...
PBS
Working with Coordinate Planes: Activities and Supplemental Materials
Seven activities make up a collection of supplemental materials to reinforce graphing on a coordinate plane. Worksheet objectives include plotting coordinates within single and four quadrants, measuring straight and...
Math Drills
Christmas Cartesian Art Tree
Spruce up graphing practice with an activity that has young mathematicians plot points on a coordinate plane, and then connect the points to create a Christmas tree.
Math Drills
Halloween Cartesian Art: Witch Hat
What is the mystery picture? After plotting points on the first quadrant of a Cartesian coordinate system, young mathematicians connect the points to create a Halloween-themed picture.
Willow Tree
Slope
Investigate the different types of slope using graphs and ordered pairs. Scholars use the slope formula to determine the slope of a line between two points. Includes examples with a slope of zero and with no slope. The lesson follows a...
Baylor College
Global Atmospheric Change: The Math Link
Change up the classroom atmosphere with this interdisciplinary resource. Following along with the children's book Mr. Slaptail's Curious Contraption, these math worksheets provide practice with a wide range of topics including...
Curated OER
Graphing Equations
For this graphing equations on a grid worksheet, students solve 10 problems. Students find the value of y for the value of x in the equations. Students make a table of ordered pairs and graph them on a grid.
Curated OER
Graphing Linear Inequalities
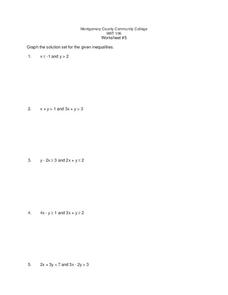
In this graphing linear inequalities worksheet, 9th graders solve 5 different pairs of problems. For each pair of equations, they graph the solution set for each the given inequalities. Then, they determine if any or all of the solution...
Curated OER
Making an Alien Mask Using Coordinate Pairs
In this math learning exercise, students create an alien mask and practice graphing coordinate pairs. Students follow the directions to plot coordinates on an x and y axis. When they are finished students will see an alien face which can...
Curated OER
Off to College
High schoolers investigate linear, quadratic and exponential equations using the TI calculator. They identify relation and functions using ordered pairs, graph the data, analyze the data, and relate it to real-world situations.
Curated OER
Number lines and graphs
In this number lines and graphs worksheet, students identify points on a number line and in a graph. Students complete 10 multiple choice questions.
Curated OER
It's a Drag!
Students create number lines using decimals and whole numbers. In this algebra lesson, students graph and solve linear equations. They plot ordered pairs on a coordinate plane correctly.
Curated OER
Investigating Linear Equations Using Graphing Calculator
Learners investigate linear equations using the Ti-Calculator. In this algebra lesson, students graph lines and identify the different quadrants on a coordinate plane. They identify ordered pairs used to plot lines.
Curated OER
A Second View of Polar Coordinates
In this polar coordinates worksheets, students change ordered pairs from rectangular form to polar form. They plot and label points and identify alternative coordinate pairs for given points. There are approximately 20 problems on this...
Inside Mathematics
Party
Thirty at the party won't cost any more than twenty-five. The assessment task provides a scenario for the cost of a party where the initial fee covers a given number of guests. The class determines the cost for specific numbers of guests...
Illustrative Mathematics
Identifying Graphs of Functions
Match the graph with its function in an exercise that focuses on variations of the graph of y = e^x. Learners are given four graphs on the same set of axes and four functions, all involving e^x. The task is to match each...
Los Angeles County Office of Education
Assessment for the California Mathematics Standards Grade 5
Test young mathematicians' knowledge with an assessment aligned to California's fifth grade state standards. The exam covers a multitude of concepts including fractions and decimals, positive and negative numbers, measurement; and...
EngageNY
Modeling Linear Relationships
Math modeling is made easy with the first installment of a 16-part module that teaches pupils to model real-world situations as linear relationships. They create graphs, tables of values, and equations given verbal descriptions.
Other popular searches
- Graphing Ordered Pairs
- Graphing Coordinate Points
- Ordered Pair Graphing Paper
- Graphing Ordered Pair Ts


