Curated OER
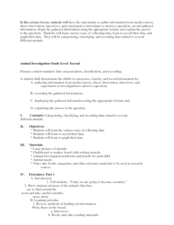
Animal Investigation
Third graders gather information and classify animals. In this animal investigation lesson, 3rd graders research animals, and organize the information into notebook.
Curated OER
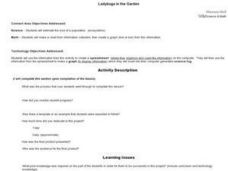
Ladybugs in the Garden
Fifth graders estimate the size a population (ecosystems) Students make a chart from information collected then create a graph (line or bar) from this information. Students do a lesson where they observed, examine, and record data...
Curated OER
Math: Collecting and Analyzing Date
Children count how many of an activity they can do in a row, such as ball tossing and record the date and count. Children track over a period of time and graph results.
Curated OER
Tag It and Bag It: Archeology Lab Lesson
Seventh graders practice analyzing, collecting and categorizing artifacts. Using charts, they organize and interpret information about the artifacts they classified. They work together to create a graph to represent class totals and...
Curated OER
Firewood Problem
Students write and solve their own story problems. They determine the cost of firewood by the cord. They organize their data in graphs and charts.
Curated OER
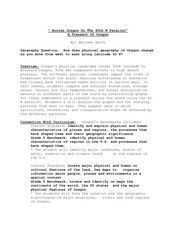
"Across Oregon On The 45th N Parallel" A Transect of Oregon
Students explore the physical geography of Oregon. In groups, students collect weather and elevation information on Oregon. They organize the data and create maps and graphs of the information. Afterward, students compare the...
Curated OER
Metropolitan Areas in the USA
Fifth graders explore why people live in certain regions of the United States. They investigate information on specific metropolitan areas such as temperature, population, natural resources, precipitation and landforms. In groups, 5th...
Curated OER
Finding the Percent of a Number in Fish Body Weight
Students use fractions to find the weight of fish. They use percentages to determine the correct amount to feed them. They organize their data into a graph and shares with the class.
Curated OER
Arsenic Contamination: Water Filtration
Students work in groups to design a filtration process that will separate clean water from polluted water. They organize data in tables or graphs and present their findings to the class. Students identify further safety protocols that...
University of Colorado
Happy Landings: A Splash or a Splat?
Huygens spacecraft landed on Saturn's moon Titan in 2005, making it the farthest landing from Earth ever made by a spacecraft. In this hands-on activity, the 12th installment of 22, groups explore how density affects speed. To do this,...
Center for Learning in Action
Density
Explore the concept of density within states of matter—gases, liquids, and solids—through a group experiment in which young scientists test objects' texture, color, weight, size, and ability to sink or float.
Missouri Department of Elementary
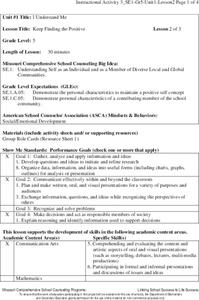
Keep Finding the Positive
Group members take on roles to create a positive classroom community. Learners perform their role—leader, recorder, presenter, timekeeper, encourager, and collector—in preparation for a formal presentation of their positive thinking...
Missouri Department of Elementary
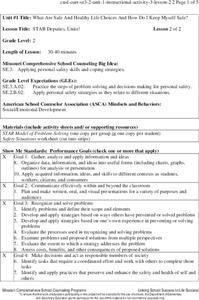
STAR Deputies, Unite!
STAR deputies unite! Scholars gather in small groups to solve problems using the STAR method. Pupils read a card that describes a situation that requires problem-solving. They role-play the scenario in front of their peers.
CK-12 Foundation
Capacitor Simulation
The camera flash works based on a simple circuit, but why does it require a capacitor? Scholars work through two levels of simulations related to circuits and capacitors. The pupils first use a simple circuit with a battery, resistor,...
Curated OER
Synthesis of Information
Locating and synthesizing information is an essential part of the research process but can be overwhelming for many young writers. Eliminate some of the stress and confusion, this resource suggests, by separating these steps. To focus...
Curated OER
Measuring Mania
Students rotate through stations in the classroom, completing different types of measurements. These measurements are placed into a spreadsheet, and a scatter plot is generated. They type an explanation of their results in correlation...
Curated OER
Introduction to Scatter Plots and Correlation
Students examine the concept of scatter plots. They compare baseball statistics to locate the ones that correlate with winning, and identify the positive, negative, and no correlation in sets of data using MS Excel.
Curated OER
M&M Exponential Activity
Students create a scatter plot of their experimental data. In this algebra lesson, students use M&M's to determine an algebraic model. They discuss results in class.
Curated OER
Microsoft Excel Lesson Plan
Fifth graders collect, organize, interpret data. In addition, they compare different textures, color including graphical representations such as bar graph, line graph .Students also describe the uses of rocks and how to use that to...
Curated OER
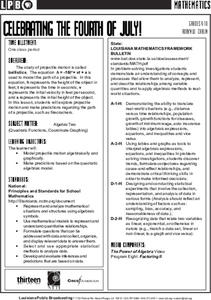
Celebrating the Fourth of July!
Students model projectile motion algebraically and graphically; and make predictions based on the quadratic algebraic model.
Curated OER
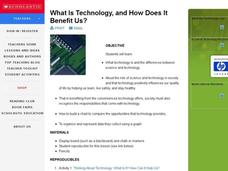
What Is Technology, and How Does It Benefit Us?
Young scholars examine and define what technology is as well as the differences between science and technology. They assess the role of science and technology in society, conveniences technology offers and create a chart to compare the...
Curated OER
Water - Planning for the Future
Students explore and examine the increases and/or decreases for water user groups: irrigation, municipal, manufacturing, steam electric power generation cooling, livestock, and mining. They utilize percentage changes during their...
Curated OER
A Bar of Many Colors
Second graders use colored candies to collect data, construct double bar graphs, and find averages.
Curated OER
Ecosystems
Students create plots of land in three different ecosystems and use AppleWorks to collect data for research. This lesson includes a downloadable worksheet and can be accomplished in four days.


