Curated OER
Island Biogeography and Evolution
Students develop likely phylogenies for seven related populations of lizards living on the Canary Islands using real data. They organize charts, and record the data for geography, geology, morphology, and molecular genetics.
Curated OER
The Effect of Math Anxiety on Cardiovascular Homeostasis
Students examine the effect stress due to test anxiety may have on the heart. As part of the experiment, students hypothesize, collect data, graph data, analyze data and formulate an understanding of their personal level of stress and...
Curated OER
Transportation Through Time
Third graders measure the speed at which they can walk in order to understand speed and distance traveled. They then research the history of transportation and express data in a class timeline.
Curated OER
Hlf-Ball
Young scholars investigate Newton's Laws of Motion and the Law of Conservation of Energy. They examine how a ball and half-ball behave and relate these laws to what happens to the ball. Students produce a graph of the data collected...
Curated OER
Nature and Fintess Trail
Students investigate how humans impact the environment and compile an organism database into an e-book field guide. They name muscle groups and develop specific exercises to strengthen these groups. Students utilize technology for data...
Curated OER
Graph a Panther's Diet
Pupils examine the diet of panthers. In this interpreting data instructional activity, students collect data on the panther's diet and chart the data in bar and pie graphs.
Curated OER
Bruchid Investigations: Bruchid Development Investigations
While this lesson plan is based on the Bruchid beetle, the focus is on conducting a scientific investigation. Ecology explorers vary the temperature or the type of leaf that Bruchid eggs are laid on and test for effects on the...
Curated OER
Paper Chromatography
Small groups of students perform paper chromatography to separate food dyes into their component colors. Students perform the experiment and collect, organize, and represent their data to form an explanation of their outcomes. Students...
Curated OER
Where In the World Are We?
Fifth graders read postcards and find their locations on maps. They use the pictures and text on the postcards to write about imaginary vacations. They compute the mileage and compare it to TripMaker data.
Curated OER
Oil Embargo!
Ninth graders generate and analyze data to determine which and how much of two polymers best absorb oils, formulate procedure to accurately determine how many times its own weight particular polymer can absorb, and develop understanding...
Curated OER
KEEP ON TRUCKING
Students comprehend and apply concepts of data analysis and distributions by observing modes of transportation for food and fiber products. They are given an activity sheet "On the Lookout for Agriculture." Students discuss the discuss...
Curated OER
Using Charts, Graphs, Tables, or Charts
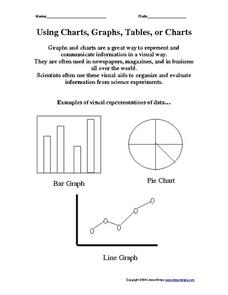
In this charts, graphs and tables activity, students view 3 different types of visual representations of data, make a list of 20 items and decide how the items can best be put together in groups to make a graph, chart or table. Students...
Curated OER
Rockets: Kinematics or Energy?
Students construct model rockets, measure and record the height of the launch. In this creative lesson students use different methods to calculate velocity and height data from their launched rockets.
Curated OER
Giants of the Century
Middle and high schoolers study significant people who shaped the 20th-century history and are introduced to database tools. Researchers use the Internet to research five 20th century history makers. They write a short biography of five...
Curated OER
Cancer: A Crisis of the Cells
Pupils analyze cancer data represented in graphs and charts. They describe the changes in cell structure and function as the result of cancer. They also examine phenomenas that are believed to cause cancer.
Curated OER
I'm a Weather Watcher Watching plants grow by......my,my,my
Students investigate how weather affects how plants grow. They collect data on weather and plant growth for a week and display the data on a graph. For a culminating experience they design a movie using software that shows plant growth...
Curated OER
School Counseling and Home Economics
Eighth graders demonstrate the ability to select and evaluate media. Apply appropriate skills to collect, organize and interpret data. They research a variety of ways to make correct career choices.
Curated OER
Forensics 101
Students interpret how to communicate information and ideas in ways that are appropriate to the purpose and audience through spoken, written, and graphic means of expression. They use information-gathering techniques, analyze and...
Curated OER
Planet Research and Brochure
Fourth graders design a brochure based on the planet that they researched. In this planets lesson plan, 4th graders include the data, important facts, and completed as a team.
Curated OER
Density of a Sinker
Eighth graders determine the density of a sinker by first finding the mass and then the volume using a graduated cylinder. Students must write the procedure they use to find the volume of the sinker then apply their data to follow-up...
Curated OER
Finding Caterpillars
Students examine how animals protect themselves from predators and camouflage themselves. They participate in a simulation in which they locate red and green yarn "caterpillars," organize their data, and generate a bar graph using...
Curated OER
2D Concept Visualization: Cell Organelles Presentation
Students create simple 2D concept driven visualizations of cells and cell organelles and organize them into an effective presentation.
Curated OER
The Ultimate Athletic Background
Eighth graders analyze the criteria used to identify "Soul of a Champion" athletes. For this Current Events lesson, 8th graders write, edit and organize a script for a “live” documentary on the athlete. Students rehearse and perform...
Curated OER
Infinite Secrets
Students duplicate the method that Archimedes used to estimate the value of pi. They complete a data table and find the approximate values of pi for three sets of polygons.


