Curated OER
Changes in Pulse Rate
Eighth graders practice making observations and collecting data after determining a baseline pulse rate then collect data on the changes in that rate with exercise. Students must organize their data and analyze their observations.
Curated OER
Rate of Solution
Eighth graders determine the amount of agitation necessary to dissolve various sized sugar particles. This task assess students' abilities to collect, organize, and interpret data, create appropriate graphs, predict future events based...
Curated OER
The Ups and Downs of Weight and Mass
Students explore the concept of mass, and how it differs from weight. They also calculate their weight change as they ride up and down on an elevator. They record the changes in their weight as the elevator moves
graph the collected data.
Curated OER
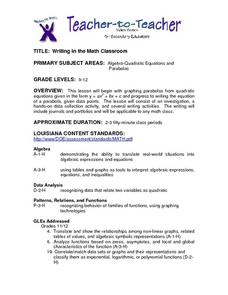
Writing in the Math Classroom
Students determine the vertex, y-intercept and direction of a parabola and write an explanation of how to graph a parabola. They collect and graph data using a calculator.
Curated OER
Line of Best Fit
Students explore the concept of linear regression. In this linear regression lesson, students do a Barbie bungee activity where they collect linear data. Students plot their data using a scatter plot. Students determine a line of best...
Curated OER
Different Perspectives of Oregon's Forest Economic Geography
Students map data on employment in wood products manufacturing in Oregon counties. In this Oregon forest lesson, students discover the percentage of people employed in the forest manufacturing industry. Students create a box and whisker...
Curated OER
Linkages Between Surface Temperature And Tropospheric Ozone
Students collect and interpret data to make predictions about the levels of ozone in the atmosphere. Using the internet to collect data students use their collected data to create a line graph for analysis. Students make mathematical...
Curated OER
A Study of a Quadratic Function
Young scholars factor and solve quadratic equations. In this algebra lesson, students play a game as the collect and graph data. they identify properties of their parabola and make predictions.
Curated OER
I'm a Weather Watcher Watching plants grow by......my,my,my
Students investigate how weather affects how plants grow. They collect data on weather and plant growth for a week and display the data on a graph. For a culminating experience they design a movie using software that shows plant growth...
Curated OER
Mapping Possible Solutions
Fourth graders propose possible sites for the heart of Florida state capital by mapping collected data onto a Florida state map and recording data in a Travel Log.
Curated OER
Water Regulation
Students use their basic knowledge of physiology to analyze graphical data of paramecia under diverse conditions. From the data analysis, Students develop explanations of the animal's response to the concentration of different solutions...
Curated OER
Hopper Hunt: IPM Decision-making in Alfalfa
Learners describe migrations and life cycle pattersn of a key alfalfa pest, the Porato Leafhopper. They define the Economic Inquiry Level and Economic Threshold. Students evaluate data in relation to profit as it applies to IPM. They...
Curated OER
Water - Planning for the Future
Students explore and examine the increases and/or decreases for water user groups: irrigation, municipal, manufacturing, steam electric power generation cooling, livestock, and mining. They utilize percentage changes during their...
Curated OER
Graphs Galore
Fourth graders conduct surveys to collect data. They analyze and interpret the data, then determine which type of graph is appropriate for the data. Students use the data to make predictions, discover patterns and draw conclusions...
Curated OER
Creation Mythology
Students construct a map from geographic data and explain relationships found in the information. Students identify ancient beliefs and customs through Hawaiian creation myths while comparing similarities and differences and appreciating...
Curated OER
Can you Find the Expression
Students collect data from measurements and weights for this experiment. In this algebra lesson, students analyze graphs they create form their data to find the expression representing the data. They label which graph provided the best...
Curated OER
Using Charts and Graphs to Study East Asia's Modern Economy
Students examine East Asia's modern economy. In groups, classmates use the internet to compare the resources, products, and economy of specified countries. After collecting the data, pupils create charts, tables and graphs. They...
Curated OER
Boxplots Introduction
Students describe the pattern of a bell curve graph. In this statistics lesson, students move data around and make observation about the mean, and the quartiles. They define boxplot, outlier, range and other important vocabulary words...
Curated OER
Investigate Science Using Crayfish
Young scientists discover the importance of scientific investigation by observing live crayfish. They carefully observe the patterns of crayfish in different environments. Then they discuss their conclusions and define what all living...
Curated OER
Changing Ramp Heights
Learners conduct an experiment to determine how the change in ramp height affects the distances a ball is able to move a stationary cup. Data is collected from several trials and recorded and analyzed.
Curated OER
Family Vacation
Students use math to plan a trip by houseboat down the Mississippi River. They research and obtain information on the Mississippi River and its surroundings and use multiple graphs to represent their data.
Curated OER
Radioactive Decay Curve
Students gather and organize data. In this radioactive decay curve lesson, students gather data as they follow the provided procedures for rolling dice. Students chart their data and examine interval results.
Curated OER
How Do They Relate? Linear Relationship
Students collect information and use a line to represent it. In this algebra lesson, students investigate real world data to see if it makes a line. They graph the line comparing the relationship of the x axis with that of the y axis.
Curated OER
Identifying Creatures
Young scholars use a classification key from a provided worksheet to identify creatures. This task assesses student's abilities to interpret data, make decisions, identify, and classify.


