Curated OER
How are Things Lining Up
In this consumer math worksheet, students use the web to research and select a stock to buy. Students track and graph the stock’s activity over a two week period. The one page worksheet contains a blank graph and four...
Curated OER
Rate Distortion
In this rate distortion worksheet, students solve 4 different sets of problems that include defining the rate distortion curve in various situations. They construct a rate distortion curve by plotting and angle against a particular line...
Noyce Foundation
Sewing
Sew up your unit on operations with decimals using this assessment task. Young mathematicians use given rules to determine the amount of fabric they need to sew a pair of pants. They must also fill in a partially complete bill for...
Curated OER
Will There Be a White Christmas This Year?
Students examine historical weather data, and create map and color key that illustrates the likelihood of a white Christmas in different locations across the United States.
PBL Pathways
Do Homework?
To complete homework or not to complete homework ... that is the question. Decide whether it makes a difference on finals by doing homework. Individuals create a scatter plot and find a line of best fit for data on the percent of...
Curated OER
Cartoons for the Classroom: General Motors Bailout
Bestow background in big business bailouts on your scholars with this political cartoon analysis handout. Two cartoons focus on the General Motors bankruptcy, and its effect on American taxpayers. Background information gives context for...
Curated OER
Statistical Calculations Using M&Ms
In this frequency activity, students investigate, frequency, box plots, and percentage using a package of M&Ms. Copies of the actual correspondences with the Mars company are also included.
Curated OER
Calculating Impervious Cover in the City of Austin
Students use GIS to calculate park impervious cover in Austin, TX. They consider that there are different types of impervious cover from hard, packed dirt to cement paving. Students consider the limitations of data in several areas...
Curated OER
Spider Percentages
In this finding percentages worksheet, students will find the percent of a whole line that a spider traveled between points while walking from one end to the other.
Noyce Foundation
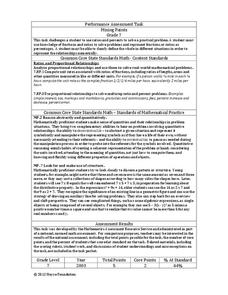
Mixing Paints
Let's paint the town equal parts yellow and violet, or simply brown. Pupils calculate the amount of blue and red paint needed to make six quarts of brown paint. Individuals then explain how they determined the percentage of the brown...
Noyce Foundation
Cereal
Find the best protein-packed cereal. The short assessment task covers equivalent and comparing ratios within a context. Pupils determine the cereal with the highest ratio of protein. A rubric helps teachers with point allotments for...
Inside Mathematics
Quadrilaterals
What figure is formed by connecting the midpoints of the sides of a quadrilateral? The geometry assessment task has class members work through the process of determining the figure inscribed in a quadrilateral. Pupils use geometric...
Virginia Department of Education
May I Have Fries with That?
Not all pie graphs are about pies. The class conducts a survey on favorite fast food categories in a instructional activity on data representation. Pupils use the results to create a circle graph.
Making Math More Fun
Making Math More Fun
Address fundamental math skills with a series of fun math board games. With 25 games that focus on addition, subtraction, multiplication, division, place value, and percentages, kids will quickly find that math practice is their favorite...
University of Wisconsin
Measuring Slope for Rain Gardens
The slope of the land is an important feature when considering the erosion that will occur. In this resource, which is part of a rain garden unit, learners calculate the slope of the proposed garden site. Even if you are not planning a...
Curated OER
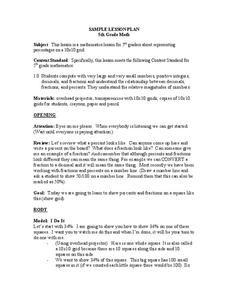
Percentages On A Grid
Fifth graders show percentages on a 10 x 10 grid. In this percentages lesson plan, 5th graders color in the squares to show a percent.
Curated OER
Circle the Earth - Explore Surface Types on a Journey around Earth
Students use CERES percent coverage surface data with a world map in locating landmasses and bodies of water at Earth's Equator.
Curated OER
Cancer Causes
Students explore why people get cancer. They explore human cells by taking a close examine their own. take a small sample of the epithelial cells that line the inside of their mouth. They glimpse how scientists investigate inside cells.
Curated OER
Staying Up
Students will explain the Archimedes's Principle. In this lesson on plankton, students will describe three factors that can affect the buoyancy of plankton. This lesson contains extensive background information, extensions, and multiple...
Curated OER
Ratio Basketball
Learners, in teams of four, practice shooting free throws while mentally converting the ratio of shots made to those thrown into a percent. They chart and record the ratio, decimal and actual percentage earned after each round.
Curated OER
ACC Basketball Statistics
Students use math skills and create a spreadsheet. In this statistics and computer skills lesson, students gather ACC basketball statistics, convert fractions to decimals and then percents. Students use the gathered information to create...
Curated OER
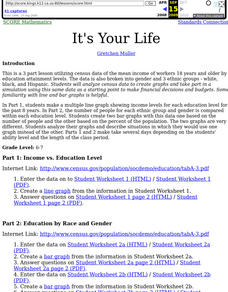
It's Your Life
Students make a multiple line graph showing income levels for each education level for the past 8 years and the number of people for each ethnic group and gender is compared within each education level.
Curated OER
Ocean Voyage Scavenger Hunt
In this ocean voyage instructional activity, students utilize the Internet to access one specific website to find the answers to five short answer questions about oceans.
Curated OER
Series-Parallel DC Circuits Series and Parallel DC Circuits
For this electrical worksheet, students draw a schematic design and build a circuit board to grasp the understanding of series and parallel DC circuits before answering a series of 41 open-ended questions. Students interpret various...


