Mathed Up!
Fractions of an Amount
After viewing a video on fractional amounts, young mathematicians put their new knowledge to the test. Throughout the assessment, class members find the fractional amount for prices, times, and populations. There are a few percent and...
101 Questions
The Incredible Shrinking Dollar
Make money disappear! Young scholars watch as a copier shrinks a dollar bill to 75 percent of its size. Learners are left to determine the size of the dollar bill after nine passes through the copier.
Kenan Fellows
Isotopic Pennies
Many people confuse atomic mass and atomic numbers. The sixth of seven lessons in a unit requires scholars to find the weight of different groups of pennies. Then, they must solve how many of each type of penny exists in a closed system...
Mathematics Assessment Project
Ratios and Proportional Relationships
Time to see what they've learned. Seventh graders solve a set of seven short problems in the ratios and proportional relationships domain. Applications include photo negatives, washing machines, coffee powder, sleep, stamps, etc.
CCSS Math Activities
Cereal
Your breakfast cereal is a good source of math practice. Young mathematicians apply ratios and percents to analyze the amount of protein and carbohydrates in two brands of cereal. They complete a worksheet to answer several questions on...
Beyond Benign
Product Test
It's the moment of truth. Previous lessons in the 24-part series had scholars design and develop shampoo formulas using chemical concepts. The 18th lesson asks them to test the function of their shampoos. To do this, they calculate the...
Beyond Benign
SLS Toxicology Test
Ingredients in your shampoo are toxic enough to kill plants. The 16th installment of the series of 24 tests the toxicity level of various concentrations of SLS, a chemical found in nearly all shampoo. Learners prepare percent solutions...
Mathematics Assessment Project
Security Camera
Only you can prevent shoplifting. Class members use a given floor plan to investigate the placement of a security camera. They must incorporate knowledge of area and percents to complete the task.
Santa Monica College
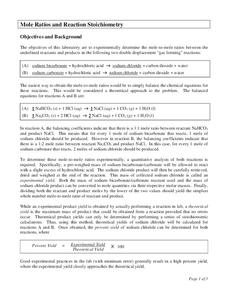
Mole Ratios and Reaction Stoichiometry
Stoichiometry sounds complicated, but it really means the study of the amount of substances involved in a reaction. The sixth instructional activity in an 11-part series has scholars use stoichiometry to find the theoretical yield of a...
Benjamin Franklin High School
Saxon Math: Algebra 2 (Section 1)
This first of twelve algebra 2 resources provides a broad review of many algebra 1 concepts through a number of separable lessons and labs. Starting with the real number system and its subsystems, the sections quickly but thoroughly...
Curated OER
Deal or No Deal?
Using a game format, learners engage in an activity called Deal or No Deal. Taking real life scenarios involving items for sale, such as cereal boxes three for $5.00, they determine whether an example is a deal or not. This lesson...
Math Worksheets Land
Patterns of Association (Using Data Tables) - Guided Lesson
The activity belongs to a four-part resource that applies percentages to data tables. The page has three practice problems that continues with the development of this topic.
Mathematics Assessment Project
Middle School Mathematics Test 6
A thorough math test divides the content into two 40-minutes sections, covering material through algebra and geometry. Problems incorporate analysis and applied problem solving.
Statistics Education Web
10,000 Steps?
Conduct an experiment to determine the accuracy of pedometers versus pedometer apps. Class members collect data from each device, analyze the data using a hypothesis test, and determine if there is a significant difference...
Inside Mathematics
Archery
Put the better archer in a box. The performance task has pupils compare the performance of two archers using box-and-whisker plots. The resource includes sample responses that are useful in comparing individuals' work to others.
EngageNY
Margin of Error When Estimating a Population Proportion (part 1)
Use the power of mathematics to find the number of red chips in a bag — it's a little like magic! The activity asks learners to collect data to determine the percentage of red chips in a bag. They calculate the margin of error and...
Rice University
Prealgebra
Pre-algebra—all wrapped up in one place. The eBook contains everything needed to teach a typical Pre-Algebra course. Concepts in the course build upon previously learned concepts, allowing mathematicians to see the connections between...
Curated OER
Interest Rates
Use a KWL chart and discussion to explore the concept behind loans with interest based on percentage rates. Learners examine different types of interest, the history of interest loans and calculate the costs of a loan over a ten-year...
Mathematics Assessment Project
Middle School Mathematics Test 2
A 13-page test with two 40-minute sections covers multiple years of math content. It incorporates applied problems and mathematical analysis.
Balanced Assessment
Chance of Survival
Class members determine the chance of surviving two years by explaining the concept of probability expressed in a medical terms. Would-be doctors continue to explain a conditional probability statement as it relates to the...
Beyond Benign
Can You Hear Me Now? Cell Phone Accounts
How sustainable are cell phones? Throughout the unit, learners explore the issues around cell phones concerning sustainability. Class members take a graphical look at the number of cell phones across the world using a box-and-whisker...
Mathematics Assessment Project
College and Career Readiness Mathematics Test B2
Use a nine-page evaluation to cover material from algebra, geometry, and algebra II. It incorporates short answer, applied reasoning, and conversion problems.
EngageNY
Margin of Error When Estimating a Population Proportion (part 2)
Error does not mean something went wrong! Learners complete a problem from beginning to end using concepts developed throughout the last five lessons. They begin with a set of data, determine a population proportion, analyze their result...
EngageNY
Margin of Error When Estimating a Population Mean (part 1)
We know that sample data varies — it's time to quantify that variability! After calculating a sample mean, pupils calculate the margin of error. They repeat the process with a greater number of sample means and compare the results.
Other popular searches
- Finding Percent of a Number
- Calculate Percent of a Number
- Finding Percent Part Whole
- Percent of Whole Numbers
- Percent of a Whole Number
- Find the Percent of a Number
- Finding Percent of Number
- Percent of Numbers
- Finding a Percent of a Number
- Percent Number Puzzles
- Percent of a Whole
- Percent Number Line


