Curated OER
Percentages Level 2
In this math worksheet, students solve the word problems in order to solve the problems using percentages. They apply the percent proportion.
Curated OER
Finding Total Given Part and Percentage
Students observe models of fractional parts. After writing the definitions of percent, part and whole, students use the calculators and computers to solve problems. Individually, they complete assigned problems where the convert the...
Curated OER
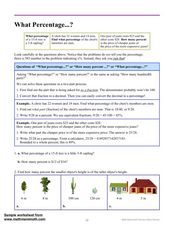
What Percentage...? #2
In this percentages practice worksheet, students read an instructional section and then solve 2 multi-part problems that require them to find percentages.
Curated OER
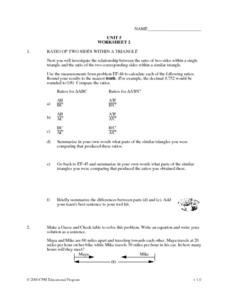
Unit 5: Worksheet 2 - Ratios
In this ratio worksheet, students investigate the relationship between the ratio of two sides of similar triangles. Afterwards, they convert fractions, decimals, and percents. This three-page worksheet contains approximately 35...
Curated OER
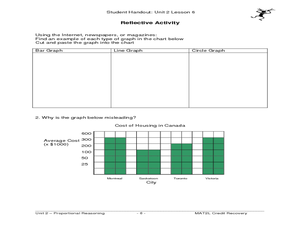
The Circle Graph
For this circle graph worksheet, students complete problems involving many circle graphs including a compass rose, degrees, and more. Students complete 7 activities.
Curated OER
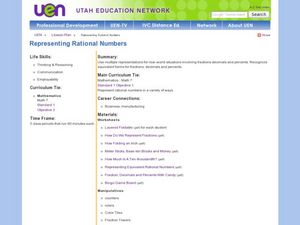
Representing Rational Numbers
Seventh graders explore rational numbers. In this fractions, decimals, and percents lesson plan, 7th graders identify and compare equivalencies between fractions, decimals, and percents. Students use hands-on activities to investigate...
Curated OER
Fraction Facts
Students are introduced to fractions, including operations with fractionsm converting fractions to decimals and percents. They are provided with activities that provide ample practice opportunities to reinforce the information from the...
Curated OER
Year 5: Percentages (2)
In this percents practice instructional activity, students use their problem solving skills to respond to 11 questions that require them to calculate the percents of the given numbers.
Curated OER
Lab Sheet: Exponential Growth and Decay
In this exponential activity, students gather information from an experiment and plot the data in a scatter plot. Using given formulas, they plot an equation of a line and then compare the graphs. Students observe exponential growth...
Curated OER
Locker Room Maxims
In this locker room maxim, students examine letters that represent words. They decipher the puzzle to reveal a cliche. This four--page worksheet contains 22 problems. Answers are provided on the last two pages.
Curated OER
Introduction to Percentages
In this percentages worksheet, students are introduced to the concept of percentages as another way to represent fractions and decimals. Students read the instructions and examples and solve 20 problems. This is an online activity that...
Curated OER
Oklahoma's Berry Best
Ask your learners to complete activities related to Oklahoma's agriculture, berries in particular. The lesson is cross-curricular and has class members investigate an article about berries, write an acrostic poem, and discuss new...
Curated OER
Percent Applications
In this percent applications worksheet, students complete a total of 10 problems that involve calculating percentages. A reference web site is given.
Noyce Foundation
Toy Trains
Scholars identify and continue the numerical pattern for the number of wheels on a train. Using the established pattern and its inverse, they determine whether a number of wheels is possible. Pupils finish...
Curated OER
Not Everything is More Expensive
Students compare prices and determine percent increases and decreases of items in order to make wise purchases. In this percent increases and decreases lesson plan, students calculate the amounts based on grocery store ads.
Curated OER
Let's Take a Trip!
Sixth graders plan a trip for a family of four choosing their travel plan by studying maps to decide upon a route and visiting Websites to get airline and travel schedules. They use ratios and proportions as well as converting fractions...
Noyce Foundation
Cereal
Find the best protein-packed cereal. The short assessment task covers equivalent and comparing ratios within a context. Pupils determine the cereal with the highest ratio of protein. A rubric helps teachers with point allotments for...
Inside Mathematics
Population
Population density, it is not all that it is plotted to be. Pupils analyze a scatter plot of population versus area for some of the states in the US. The class members respond to eight questions about the graph, specific points and...
Curated OER
Scatter Plots
In this scatter plots worksheet, students solve and complete 4 different problems. First, they use the table shown to model the relation with a scatter plot and trend line and to predict the value of a variable when given the other...
Curated OER
Finding Discount and Sale Price
Seventh graders solve real-life problems involving sales tax, discount, and simple interest. They find the amount of discount. In groups, 7th graders examine a sales advertisement. Given a budget, they choose purchases, and figure the...
Inside Mathematics
Quadratic (2009)
Functions require an input in order to get an output, which explains why the answer always has at least two parts. After only three multi-part questions, the teacher can analyze pupils' strengths and weaknesses when it comes to...
Curated OER
A.P. Calculus BC Section II, Part A and Part B
In this A.P. Calculus BC worksheet. learners solve six practice problems. A graphing calculator is required on the first three questions and not allowed on the next three. Directions are provided.
Noyce Foundation
Ducklings
The class gets their mean and median all in a row with an assessment task that uses a population of ducklings to work with data displays and measures of central tendency. Pupils create a frequency chart and calculate the mean and median....
Inside Mathematics
Party
Thirty at the party won't cost any more than twenty-five. The assessment task provides a scenario for the cost of a party where the initial fee covers a given number of guests. The class determines the cost for specific numbers of guests...


