Curated OER
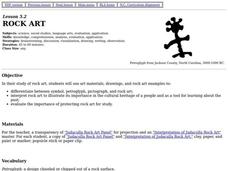
Rock Art
Fourth graders examine and interpret rock art to illustrate its importance in the cultural heritage of a people and as a tool for learning about the past. They create their own rock art that is a symbol of their culture.
Curated OER
Data From Interviews
Middle schoolers create and conduct a survey about favorite foods, gather and represent the data, interpret data and make predictions to present to the class. They create and use interview questions to gather data. Pupils are...
Curated OER
Types of Graphs
Fifth graders construct graphs. For this graphing lesson, 5th graders learn about various types of graphs such as bar, line, circle, picture and stem and leaf plot. Students work in groups to create examples of each graph.
Curated OER
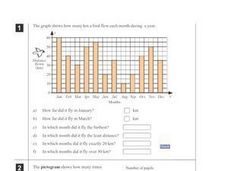
Graphs and Pictograms
In this graphs and pictograms worksheet, students analyze both a graph and a pictogram and then answer 11 questions about them. Students can click on the Check button to determine whether their answers are correct or not.
Curated OER
Pictographic Poetry of Current Events
Students discuss recent currents events as a class. Using one of the events, they write a poem about how they feel about the event in question. They choose specific symbols that relate to event and write a poem about it as well. They...
Curated OER
Organizing Data Using Tables and Graphs
Students create graphs and tables, as well as interpret and make inferences from the data shown to determine when and where graphs and tables are most useful.
Curated OER
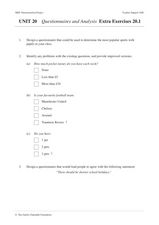
Unit 20 Questionnaires and Analysis Extra Exercises 20.1
In this statistics worksheet, students design a biased questionnaire. They create data displays based on given statistics. There are a total of 9 problems.
Curated OER
What's Your Favorite Season?
Students collect data on the favorite seasons. In this data collection and analysis instructional activity, students learn about displaying data on charts and graphs. They collect data about the favorite seasons of the children in their...
Mathed Up!
Pictograms
Young mathematicians read, interpret, and complete a variety of real-world pictograms. Each question includes a key and information to complete the graphs.
Curated OER
Picture Graphs
An innovative way to practice reading data, as well as the four operations! Three picture graphs prompt first graders to count marbles, books, and pets. They also solve addition and subtraction problems. Additionally, they work on...
Curated OER
Chapter 12 Writing: the ABCs of Language
Providing a thorough presentation on the art of written language (and not just English), this slideshow will open your students' eyes to the sociological and linguistic issues surrounding writing systems, both modern and historical. The...
Alabama Learning Exchange
I Know What You Did Last Summer: A Data Graphing Project
Young scholars participate in graphing data. In this graphing data lesson plan, students make a stem and leaf plot of their summer activities. Young scholars create numerous graphs on poster boards. Students discuss the differences...
Curated OER
Graph Club 2.0 Matching
Second graders study graphing using pictographs and bar graphs. They graph pie charts, line graphs, and also change the graph scale up to 1000. They use the pictograph on the left to create the same graph on the right using a bar graph.
Curated OER
Data Analysis, Probability, and Discrete Mathematics
Fourth graders analyze the data in a bar graph, pictograph, line graph, and a chart/table and draw conclusions based on the data. They discuss each type of graph, write questions for each graph, and analyze the data as a class.
Curated OER
Snack Attack
Students design charts, tables, graphs, and pictographs to analyse the types of snacks in a bag.
Curated OER
Worth a Thousand Words
First graders examine the significance of the American bison to the American Indians of the Great Plains. They create a story in pictographs in the style of American Indians of the Plains.
Curated OER
Comparing Data on Graph A and Graph B
Second graders gather and graph data. In this graphing lesson, 2nd graders collect data and graph this information using tally charts, bar graphs, pictographs, or tables. They make predictions about the outcomes.
Curated OER
The Huexotzinco Codex
Learners will analyze a set of pictograph documents created by native peoples of Puebla, Mexico in 1531. In this historical inquiry lesson, students take on the role of historians and study the documents. Learners construct a scenario to...
Curated OER
Math--Pictures and Bars--Learning About Graphs
What is a graph? What does it tell us? How do you make one? These are all questions that are answered in the included packet. It's a great introduction to graphing for young learners!
Houghton Mifflin Harcourt
Unit 1 Math Vocabulary Cards (Grade 1)
Reinforce mathematical vocabulary with the use of flash cards. Each card showcases a boldly typed word as well as a labeled picture representation of the word. Terms include addition, subtraction, greater than, less than, and more!
Curated OER
Probability and Statistics
Elementary schoolers choose from a host of activities to investigate probability and statistics. They complete worksheets, create 3-D graphs, and play graph bingo. They make weather predictions and list all the possibilities before going...
Curated OER
A Blast of Math
For this metric measurement worksheet, students solve 20 fill in the blank questions related to metric measurement, converting metric units, area of rectangles, picture graphs, patterns, geometric shapes. Students then convert 9...
August House
The Contest Between the Sun and the Wind
Learn the moral of the story with a series of activities about Aesop's fables. Focusing on The Contest Between the Sun and the Wind, learners complete a graphic organizer to discuss who, what, how, and why the events occur. Additionally,...
American Statistical Association
The Taste of Yellow
Does lemonade taste better when yellow? A tasty experiment has scholars determine the answer to the question. It requires conducting a taste test with lemonades of different colors (from food coloring), and then collecting and analyzing...
Other popular searches
- Bar Graphs Pictographs
- Pictographs and Bar Graphs
- Tally Charts and Pictographs
- Tally Charts or Pictographs.
- Math Pictographs
- Iroquois Indians Pictographs
- Interpreting Pictographs
- Native American Pictographs
- Sioux Indians Pictographs
- Reading Pictographs
- Math, Pictographs
- Math Lessons Pictographs


