Worksheet Web
Using Pictographs
If one ice cream cone represents three ice cream scoops, and Bob has four ice cream cones, then how many scoops does Bob have? Learners solve these kind of questions with their new understanding of pictographs.
Curated OER
Bar Graphs and Pictographs
How are bar graphs and pictographs different? As you begin this concept, use these simple graphs to help get learners started with data analysis styles. There is one bar graph and one pictograph, each accompanied by four or five...
Curated OER
Pumpkin Picture Graph
In this pumpkin picture graph worksheet, students read and analyze each picture graph and then answer the eight questions that follow.
Math Worksheets 4 Kids
Pictograph Christmas Gifts
Add holiday cheer to math practice with a Christmas themed worksheet designed to reinforce skip counting by two and solving word problems.
K20 LEARN
Considering "Charles": Pictograms, Annotations, Reading Strategies, And Multimodal Responses
Shirley Jackson's short story, "Charles," provides middle schoolers with an opportunity to practice their close reading skills. Using the provided list of prompts, scholars read and reread the story, then create a multimodal response to...
Math Worksheets Land
Halloween Interpreting Pictograph
The best part about Halloween is the candy. Individuals read a pictograph that depicts the amount of candy five children received. Then, they respond to five questions using the picture graph to support their answers.
Curated OER
Reading the Neighborhood
First graders complete activities with the story One Monday Morning in the Macmillan/McGraw Hill Textbook. In this data instructional activity, 1st graders read the story and gather data to create a picture graph. They read the graph and...
Curated OER
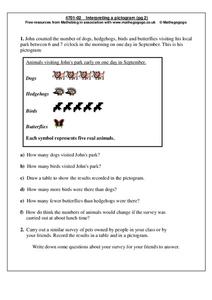
Interpreting a Pictogram
In this pictogram instructional activity, students read and analyze a pictogram about dogs, hedgehogs, birds and butterflies and then answer 6 short answer questions. Students conduct a similar survey on pets owned by their friends and...
Curated OER
Creating Stories Using Pictographs
Fourth graders research pictograph stories written by Native Americans. They investigate the history behind pictographs, and look through a reference book identifying the different pictures. The teacher then create their own individual...
Curated OER
THE EASTER BUNNY GETS READY! PICTURE GRAPH
In this graphing worksheet, students read a picture graph about colors of Easter eggs and then answer questions about the graph.
Curated OER
Using a Pictograph
For this problem solving worksheet, 5th graders answer four questions using the pictograph provided. The worksheet pertains to sports.
Curated OER
A Reading Graph
Young scholars construct and interpret a "favorite classroom books" graph. In this literacy and math graphing lesson, students choose a reduced size copy of the book cover that corresponds with the book(s) they chose to read during their...
Curated OER
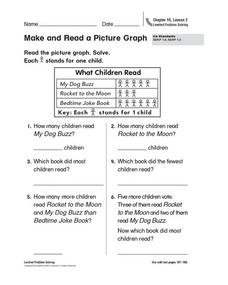
Make and Read a Picture Graph
What books do you like? Have your learners read and interpret a picture graph detailing a fictional class's favorite books. Consider conducting a survey of your learners' favorite books and plotting the results as a class!
Curated OER
Read a Picture Graph
It's the Bears vs. the Seals! Who is the season winner? Read this data and have your math class answer the six questions that follow. Consider graphing the chart as a class, or encouraging individuals to graph it before answering the...
Curated OER
Complete the Graphs
First, second, and third graders make pictographs. There are four graphs to complete, and the answer sheet is included. Consider providing your learners with special needs two sets of stickers to use, instead of requiring them to draw...
Curated OER
Rubber Band Banza
Third graders review ideas about sound and vibration to make their own stringed instrument. They review what a pictograph and bar graph are. Pupils conduct a survey within the classroom to choose the four favorite string instruments and...
Florida Center for Reading Research
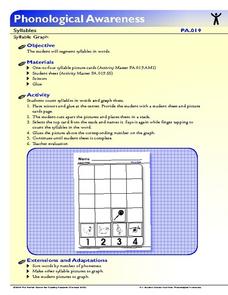
Phonological Awareness: Syllables, Syllable Graph
Scholars make a pictograph based on the number of syllables in each picture card. They choose a card, say the name of the object on the card, break the word into syllables, count the syllables, then glue the picture onto the number chart...
Mathed Up!
Pictograms
Young mathematicians read, interpret, and complete a variety of real-world pictograms. Each question includes a key and information to complete the graphs.
Curated OER
Using Pictographs With Data
In this using pictographs with data worksheet, 3rd graders read data from a pictograph to answer ten multiple choice questions. Answers can be shown on the screen.
Curated OER
Creating and Reading a Pictograph
Second graders examine how data can be transferred into pictures on a pictograph. They analyze data on a graph about chewing gum, and create a pictograph that illustrates data about their preferences for the taste of bubble gum. ...
Curated OER
Creating Stories Using Pictographs
Students participate in diverse cultural activities that lead them to a better understanding of Native American people. They use pictographs to write a story, imagining themselves as tribal members. Students transfer their story to a...
Curated OER
Read a Pictograph
In this data display activity, students solve 4 problems in which data on a tally chart and pictograph are analyzed. Students use this information to solve the problems.
Curated OER
Make a Different Graph
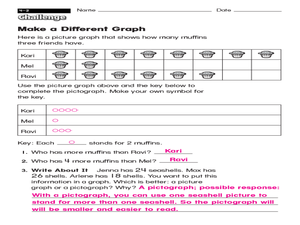
What is the difference between a picture graph and a pictograph? Young learners are given a picture graph detailing how many muffins three friends have, and they must complete a pictograph using a symbol of their choice. An answer key is...
Curated OER
Bird Pictogram Page 2
In this math worksheet, students examine a pictogram which shows the 4 most common foods of wild birds. Students analyze the pictogram and answer 8 questions about the data displayed.


