Scholastic
Scholastic: Study Jams! Math: Data Analysis: Pictograph
Watch short video clips that show step by step how to organize data and create a pictograph. Then check for understanding by testing yourself.
Cuemath
Cuemath: Data Handling
This comprehensive guide about data handling helps with understanding how the study of data handling and graphical representation of the data along with other tools help us in dealing with numerical data. Includes solved examples and...
Cuemath
Cuemath: Pictographs
A comprehensive guide for learning all about pictographs with definitions, solved examples, and practice questions.
E-learning for Kids
E Learning for Kids: Math: Pizza (Italian) Restaurant: Data and Chance
In this interactive site, students practice with bar and picture graphs by helping a pizza place collect and analyze their data.
Mangahigh
Mangahigh: Data: Use and Interpret Pictographs
This site provides students practice with the concept of pictographs. Students can learn about the topic by completing an interactive tutorial. Students can then take a ten question timed test to practice the skill.
ClassFlow
Class Flow: Data Analysis Using Graphing
[Free Registration/Login Required] This flipchart allows students to analyze data using appropriate graphs, including pictographs, histograms, bar graphs, line graphs, circle graphs, and line plots introduced earlier, and using...
E-learning for Kids
E Learning for Kids: Math: Orange Trees, Olive Trees: Data and Capacity
In this lesson, students collect data related to a question, compare and order the capacity of containers, and interpret picture graphs.
BBC
Bbc: Representing Data
This BBC Math Bite tutorial for line graphs, pictograms, and frequency polygons features an exam in which students draw and interpret statistical diagrams.
Better Lesson
Better Lesson: Graphing Our Snack Mix: Review of Graphing
Second graders review how to make bar graphs, line plots, and pictographs by tallying the contents of snack mix and building graphs to show their data.
Khan Academy
Khan Academy: Picture Graphs (Pictographs) Review
Picture graphs are a fun way to display data. This article reviews how to create and read picture graphs (also called pictographs).
Math Is Fun
Math Is Fun: Pictographs
Explains, with examples, what pictographs are and their limitations. Includes ideas for making a pictograph and a set of practice questions.
E-learning for Kids
E Learning for Kids: Math: Treasure Island: Interpreting Data
Students will play interactive games to interpret information from different types of graphs.
Illustrative Mathematics
Illustrative Mathematics: 3.oa, Md, Nbt Classroom Supplies
The purpose of this task is for students to solve problems involving the four operations and draw a scaled picture graph and a scaled bar graph to represent a data set with several categories. Aligns with 3.NBT.A.2;...
Alabama Learning Exchange
Alex: Great Golly Graphs
This lesson plan asks learners to create a survey project including graphs, questions, tables, and data analysis. It gives an assessment and ideas for remediation and extension as well as ways to manage behavior problems and reluctant...
Khan Academy
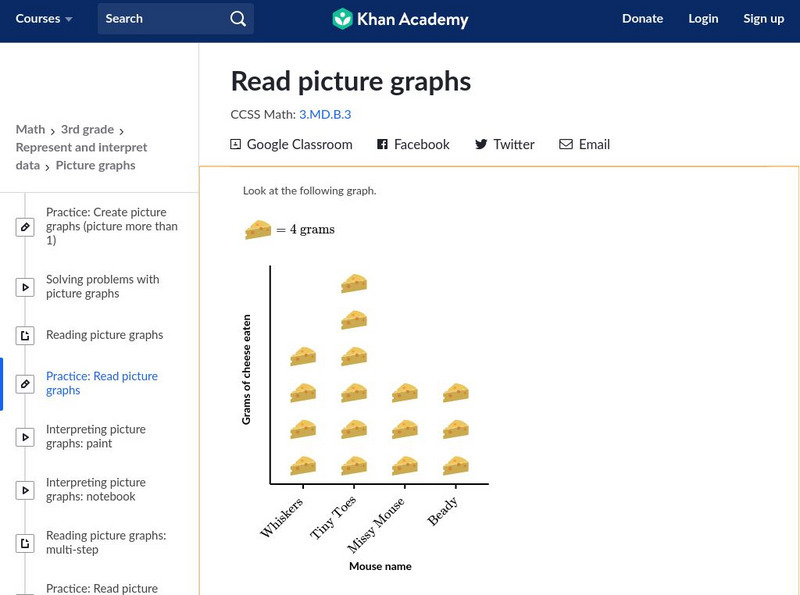
Khan Academy: Read Picture Graphs
Use picture graphs to solve word problems. Students receive immediate feedback and have the opportunity to try questions repeatedly, watch a video or receive hints. CCSS.Math.Content.3.MD.B.3 Draw a scaled picture graph and a scaled bar...
Khan Academy
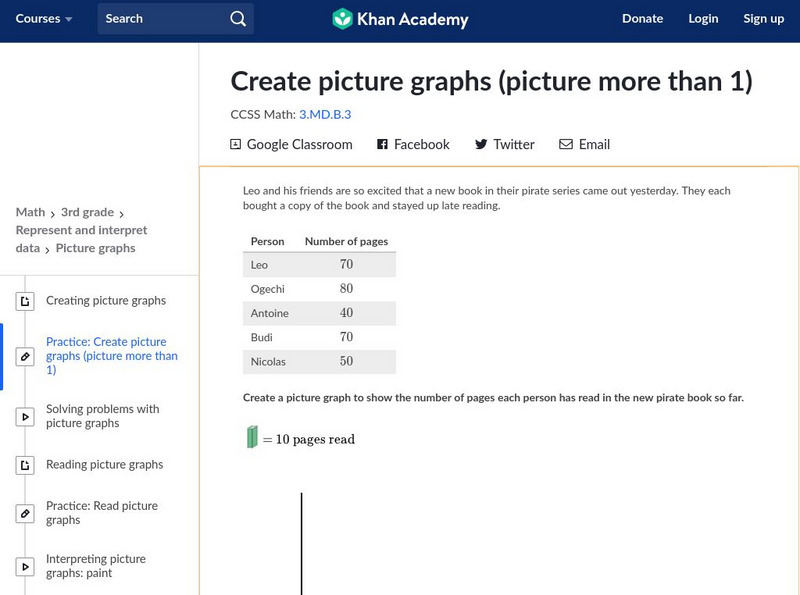
Khan Academy: Create Picture Graphs (Picture More Than 1)
Create and interpret picture graphs. Students receive immediate feedback and have the opportunity to try questions repeatedly, watch a video tutorial, or receive hints about how to create picture graphs. CCSS.Math.Content.3.MD.B.3 Draw a...
Louisiana Department of Education
Louisiana Doe: Louisiana Believes: Eureka Math Parent Guide: Collecting and Displaying Data
A guide to support parents as they work with their students in collecting and displaying data.
Education Place
Houghton Mifflin: Eduplace: Make a Living Bar Graph
Student use simple data to line up in a living bar graph activity when they respond to simple questions in this lesson plan. They physically and visually represent the data. CCSS.Math.Content.3.MD.B.3 Draw a scaled picture graph and a...
Khan Academy
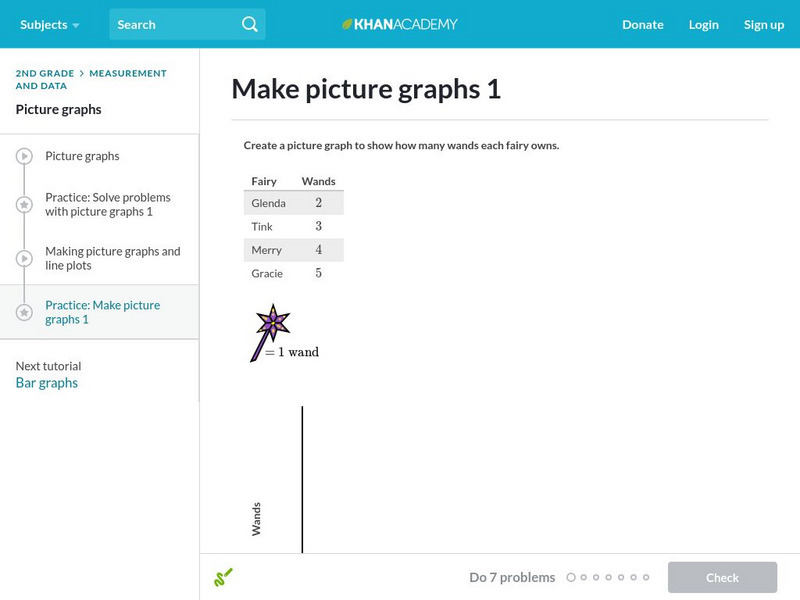
Khan Academy: Make Picture Graphs 1
Practice creating picture graphs (pictographs) from data sets. Students receive immediate feedback and have the opportunity to try questions repeatedly, watch a video or receive hints.
ClassFlow
Class Flow: Pictograph With Key Greater Than 1
[Free Registration/Login Required] This flipchart introduces reading a pictograph with a key greater than one, answering questions from data represented, find number of symbols to represent data by using a key, construct pictograph, and...
Khan Academy
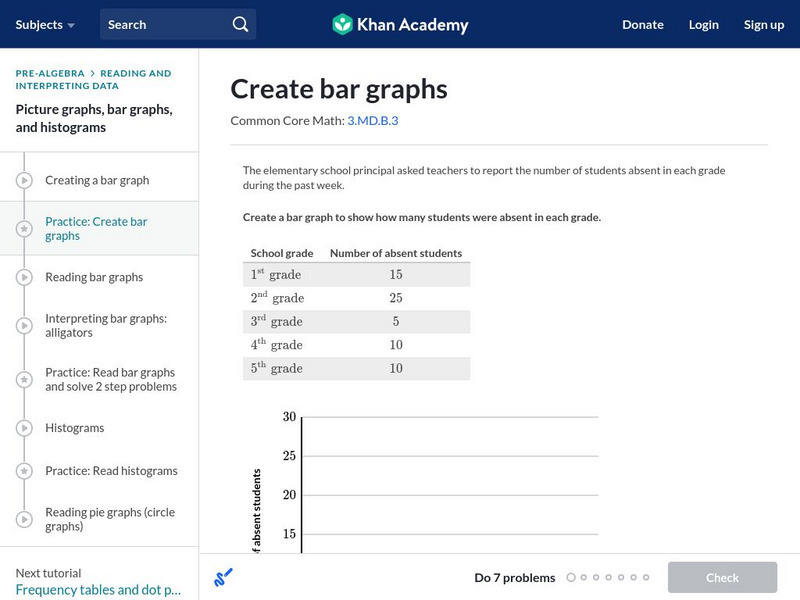
Khan Academy: Create Bar Graphs
Create a bar graph with the data given. Students receive immediate feedback and have the opportunity to try questions repeatedly, watch a video tutorial, or receive hints about creating bar graphs. CCSS.Math.Content.3.MD.B.3 Draw a...
Khan Academy
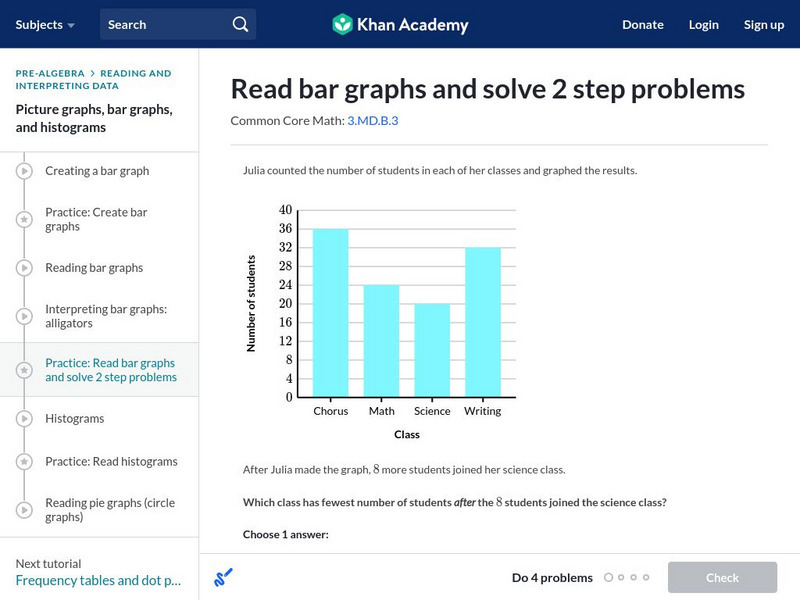
Khan Academy: Read Bar Graphs and Solve 2 Step Problems
Read and interpret a double bar graphs. Students receive immediate feedback and have the opportunity to try questions repeatedly, watch a video or receive hints. CCSS.Math.Content.3.MD.B.3 Draw a scaled picture graph and a scaled bar...
Better Lesson
Better Lesson: Graphing Our Favorite Ice Cream
Third graders can collect and represent data with a unique scale.
ClassFlow
Class Flow: Thanksgiving Graphing
[Free Registration/Login Required] Students will interpret data from a bar graph and a pictograph. They will then create one of each on the Activboard. This flipchart includes links to websites and an Activote quiz.


