Oswego City School District
Regents Exam Prep Center: Practice With Organizing and Interpreting Data
Several problems are presented to test your skills in creating and interpreting frequency tables, pie charts, box-and-whisker and stem-and-leaf plots.
Texas Education Agency
Texas Gateway: Analyze Graphical Sources: Practice 2 (English I Reading)
You will look at each of these types of graphs: bar graph, line graph, pie charts, as you work your way through the lesson.
Sophia Learning
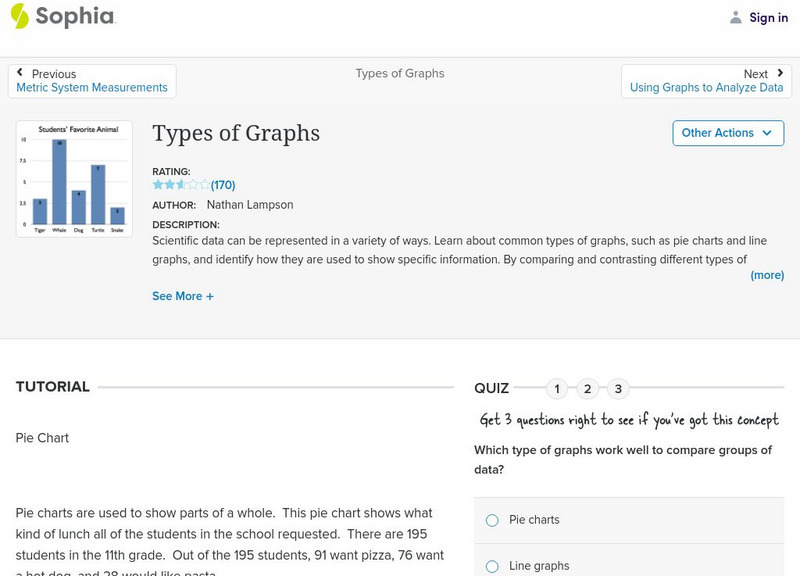
Sophia: Types of Graphs
This presentation allows the learner to visualize the different types of graphs used to display data in scientific investigations.
Better Lesson
Better Lesson: Circle Graph Activity
This lesson will allow the student to work through three stations. The stations will focus on creating and analyzing circle graphs. The students will be using technology to create their graphs along with a hands on activity using M &...
Other
Online Statistics Education: Graphing Distributions [Pdf]
This is the second chapter of a statistics e-text developed collaboratively by Rice University, University of Houston Clear Lake, and Tufts University. It looks at many different types of data displays and the advantages and...
US Department of Education
Nces: Create a Graph: Kids Zone
Make your own pie, bar, line, area or XY graph with this interactive tool. Look for examples of graphs already created from data collected by the National Center for Education Statistics. Complete with a graphing tutorial.
E-learning for Kids
E Learning for Kids: Math: Elephant Plant: Data and Graphs
On this interactive website students practice various math skills using a real-life scenario involving plants. Those skills include interpreting data in a circle graph, interpreting data in a divided bar graph, and interpreting a bar...
Beacon Learning Center
Beacon Learning Center: Kinds of Graphs
An interactive web lesson introduces five types of graphs to students and allows them to practice matching the names to examples.
E-learning for Kids
E Learning for Kids: Math: Group of Pyramids: Fractions and Graphs
On this interactive website, students practice various math skills using a real-life scenario at the pyramids. Those skills include showing percentages as fractions and decimals and interpreting data in a sector graph.
PBS
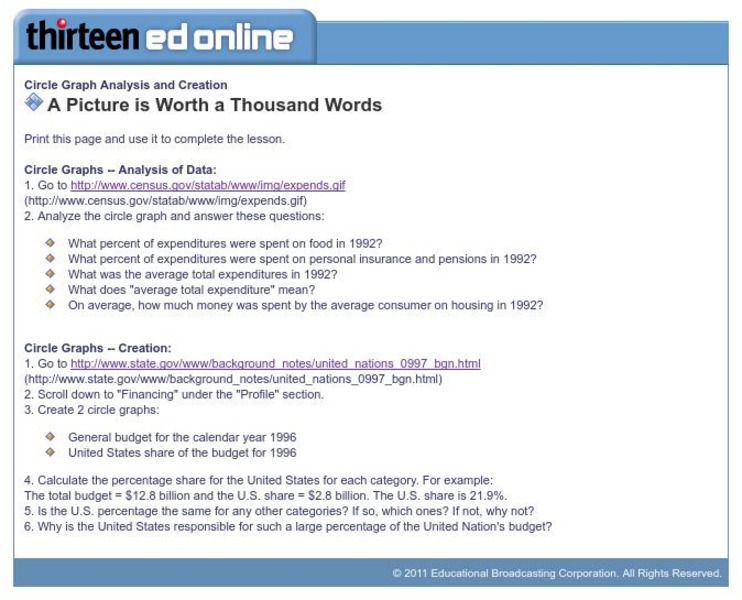
Wnet: Thirteen: Circle Graph Analysis and Creation
This site, which is provided for by WNET, gives a great way to practice using circle graphs through these exercises. One is analyzing a pie graph from the Census Bureau and the other creating pie charts using government data.
ClassFlow
Class Flow: Using Graphs in History Class
[Free Registration/Login Required] This flipchart covers the major types of graphs used in social studies such as bar graphs, line graphs, pie graphs, and pictographs. Information on graphs is followed by graphs dealing with salaries...
Math Aids
Math Aids: Graph Worksheets
Great resource to practice and strengthen math skills pertaining to graphs. Math worksheets are printable, may be customized, and include answer keys.
Varsity Tutors
Varsity Tutors: Hotmath: Practice Problems: Circle Graphs
Two problems present practice creating a circle graph from a data table. Both are given with each step to the solution cleverly revealed one at a time. You can work each step of the problem then click the "View Solution" button to check...
Education Development Center
Tune in to Learning: Reading Charts and Graphs
Practice graph reading skills with these exercises and companion tutorials.
Other
Tulpehocken Area School District: Graphing and Analyzing Scientific Data
Student worksheet with explanation of pie, bar, and line graphs, the parts of a graph, and the definition of mean, median, and mode. This summary is followed by an exercise for each type of graph within a scientific context.
TeacherLED
Teacher Led Interactive Whiteboard Resource Survey
Students can explore surveys, pie charts, and bar graphs with this interactive white board resource.
Better Lesson
Better Lesson: Analyzing and Creating Circle Graphs
Sixth graders will be learning through exploration on how to analyze and create circle graphs and Venn diagrams.
Math Is Fun
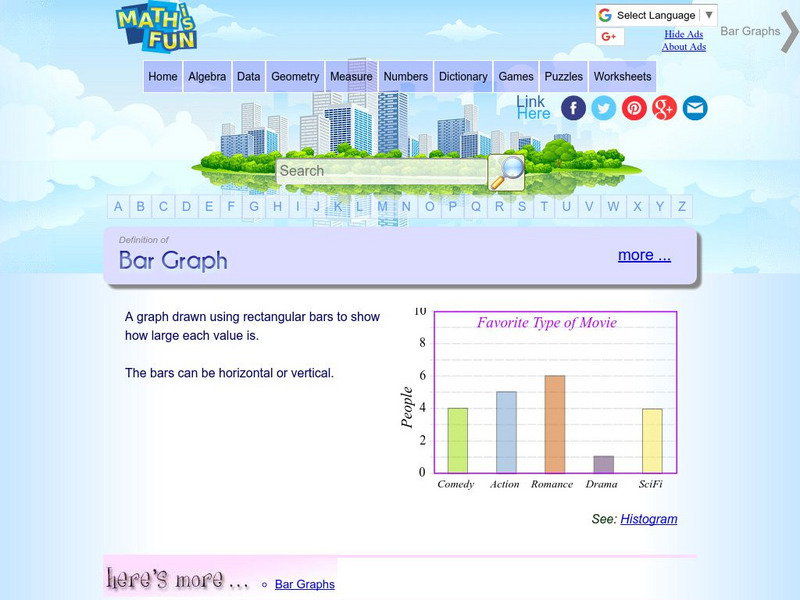
Math Is Fun: Definition of Bar Graph
Get the definition for a bar graph. Then, select the link "here's more" and use the interactive graph to display data as a bar graph, line graph or pie chart. The finished graph may be printed.
E-learning for Kids
E Learning for Kids: Math: Movie Theater: Circle Graphs
On this interactive website, students practice interpreting information in circle graphs.
Shodor Education Foundation
Shodor Interactivate: Misleading Graphs
This lesson will challenge young scholars to think creatively by having them design and build water balloon catchers from random scrap materials, while requiring them to take into consideration a multitude of variables including cost,...
ClassFlow
Class Flow: Charts Handling Data
[Free Registration/Login Required] Reading graphs fit together with this engaging, colorful flipchart analyzing pie charts, bar graph, percents, and fractions.
ClassFlow
Class Flow: Reading Circle Graphs
[Free Registration/Login Required] Students are asked to figure out the size of the shaded portions of a circle graph. They then complete a chart showing the fraction, decimal, and percentage equivalents.
CK-12 Foundation
Ck 12: Types of Data Representation: Graphic Displays of Data
[Free Registration/Login may be required to access all resource tools.] Here you will explore displays of data using bar charts, histograms, pie charts and boxplots, and learn about the differences and similarities between them and how...
Sophia Learning
Sophia: Using Graphs to Analyze Data
This lesson will demonstrate how to analyze and interpret data given in the form of a graph.


