Curated OER
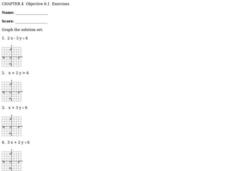
Graphing Inequalities
In this graphing inequalities worksheet, students solve and graph the solution set for eight inequalities. They first solve each inequality, either for x or for y, then they plot the coordinates found on the graph provided for each...
Curated OER
Graphing Polar Equations
In this graphing polar equations worksheet, students solve and complete 10 various types of problems. First, they construct a table of values using the special angles and their multiples. Then, students plot the points in the table on a...
Thomson Brooks-Core
Complex Numbers
A straightforward approach to teaching complex numbers, this lesson addresses the concepts of complex numbers, polar coordinates, Euler's formula, De moivres Theorem, and more. It includes a practice problems set with odd answers and a...
Curated OER
Spaghetti Bridges: Student Worksheet
In this math worksheet, students will create a "bridge" out of spaghetti and test it's strength with pennies. Students will record their results on a table and then graph the results.
Curated OER
Exponential Functions
In this exponential functions worksheet, 9th graders solve and complete 23 various types of problems. First, they simplify each expression. Then, students evaluate the function at different values of x and plot the ordered pairs. in...
Curated OER
Walking the Plank
This is a cool math activity. Kids collect and interpret data based on a physical act. A board is balanced between a scale and a step, learners record a peer's weight as it decreases while s/he walks further away from the scale. They...
Curated OER
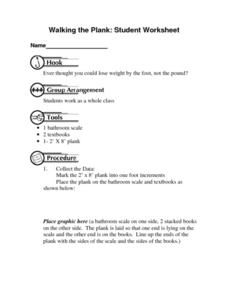
Walking the Plank: Student Worksheet
In this math worksheet, learners will work in a group to experiment with the weight of objects when placed at a distance from a scale (using a plank). Students will record and graph their results.
California Education Partners
Science Fair Project
Plant the data firmly on the graph. Given information about the growth rate of plants, pupils determine the heights at specific times and graph the data. Using the information, scholars determine whether a statement is true and support...
Curated OER
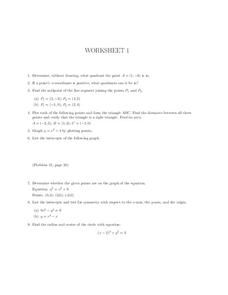
Worksheet 1, Coordinate Graphing
In this algebra worksheet, students determine the quadrant a given point is in. They find the midpoints of two line segments. Students plot points to form a triangle and find the distance between points. Students find the area of the...
Curated OER
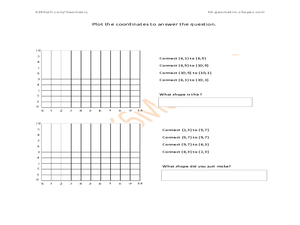
Plot the Coordinates
In this plotting coordinates activity, students plots sets of coordinates on graphs, then identify the shape the connected points have created. A reference web site is given for additional activities.
Curated OER
Plotting Coordinates
In this coordinates worksheet, students plot sets of coordinates, connected them and creating letters. A reference web site is given for additional activities.
Curated OER
Analytic Geometry
In this analytic geometry worksheet, 9th graders graph and solve 13 different types of problems that include determining whether equations are linear to matching given equations to their corresponding equation in the second column....
Curated OER
Statistics
In this statistics instructional activity, students view 6 graphs to determine the correlation. Students then answer 4 questions that involve plotting data, determining a relationship, and making predictions.
Curated OER
Integration: Statistics, Scatter Plots and Best-Fit Lines
In this math worksheet, young scholars identify the type (if any) of correlation on 6 scatter plots. They use information given on a table to create a scatter plot and identify the type of correlation. Students use the scatter plot to...
Curated OER
Straight Line Graphs
In this algebra worksheet, students graph coordinate pairs on a coordinate plane. They match points with letters and graph a line through all the plotting to create a straight line. There are 25 questions with an answer key.
Curated OER
Linear Equations in Our Every Day World!
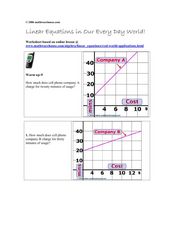
In this linear equations worksheet, students read and interpret graphed linear equations. They read a story problem, write a linear equation, and plot the points on a coordinate plane. This five-page worksheet cotnains 12 problems.
Math Mammoth
Slope; Math Mammoth.com
For this math activity, students find the slope of four lines when they are drawn on a coordinate grid. Students are given the slope and draw the line for two lines. They use the slope formula to find slope when given two points on a...
Curated OER
Shape Capture Game
In this shape capture game worksheet, 8th graders work in pairs to plot quadrilaterals, then guess ordered pairs for each other's shape in order to locate the vertices on the grid; can be used with other shape as well.
Curated OER
Position, Velocity & Acceleration vs. Time Graphs
In this graphing worksheet, students determine the speed vs. time and acceleration vs. time plots based on the velocity vs. time graph given. Students complete 2 graphs.
Curated OER
Convolution Method
In this convolution method activity, students solve 4 different equations related to convolution methods. First, they create a combined plot of the three different solutions and the forcing function. Then, students use any method...
Curated OER
Graphing Points Worksheet
In this graphing points worksheet, students plot ordered pairs on a coordinate plane. They graph 20 given problems, with 10 problems requiring students to graph two or more points.
Curated OER
Practice: Word Problems
Congratulations, you've just hit the word problem jackpot! Covering an incredible range of topics from integers and fractions, to percents, geometry, and much more, this collection of worksheets will keep young mathematicians busy...
Curated OER
Easy Worksheet: Area and Perimeter of Rectangles and Squares
In this area and perimeter of rectangles and squares worksheet, students solve 6 graphing and short answer problems. Students plot four coordinates of a rectangle or square on the coordinate plane. Students find the area or perimeter of...
Curated OER
2D Grpahing Functions
For this algebra worksheet, 9th graders graph linear equations using a line. They find values for x and y and plot them on a coordinate plane to make a line. There are 6 questions.


