PHET
Graphing Lines
Ready to increase pupils' understanding of slope with an upward slope? Scholars use an interactive that allows users to move two points on a coordinate plane. The interactive then automatically calculates the slope, the slope-intercept...
Radford University
How to Calculate and Analyze the Equation for a Parabolic Path
Working in groups, pupils plot three points on the coordinate plane representing three different parabolic paths. Using a calculator, they determine the quadratic regression equation for their models. Each team then figures out the...
Curated OER
Worksheet 24 - Derivative
In this derivative worksheet, students identify second derivatives and find the directional derivative of a function. They also list the extremes and saddle points of a function. This one-page worksheet contains seven multi-step problems.
Curated OER
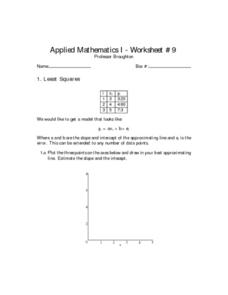
Least Squares
In this least squares worksheet, students solve 6 different problems that include the least squares of numbers. First, they plot 3 points on the axes shown and draw in their best approximating line. Then, students estimate the slope and...
Curated OER
Worksheet 25 - Chain Rule
In this chain rule worksheet, students use the chain rule and substitution to find partial derivatives. They identify total surface area, and find the distance from the origin to the plane. This one-page worksheet contains seven...
Curated OER
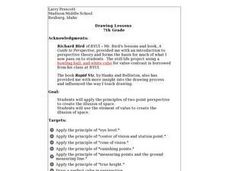
Drawing Lessons
Seventh graders complete a visual acts project that focuses on eye level, center of vision, station point, cone of vision, vanishing points, true height, and drawing a box in two point perspective. They work on a number of still life...
Curated OER
Identifying Parallel and Perpendicular Lines
Students explore basic geometry. In this geometry lesson, students study points and lines that exist in flat planes. Students investigate parallel and perpendicular lines.
Curated OER
The Building Blocks of Geometry
Fifth graders explore geometric building blocks in the real world in order to describe the characteristics and relationships of points, lines, line segments, rays, and planes. This is the first lesson plan in a series of lessons in...
Curated OER
Plot the x-y Coordinates on the Grids Below
In this coordinate grid graphing worksheet, students plot the given points onto each of 6 coordinate grids. All points are located in quadrant 1. One point is plotted on each grid. Answers are given by clicking the appropriate place on...
Curated OER
Folding to Make Shapes
Second graders identify different polygons and their attributes. In this geometry lesson, 2nd graders get to know polygons by studying the vocabulary and finding polygons in their classroom. They create these shapes and then find their...
Curated OER
Which Graphs are Functions?
In this graphing worksheet, students use the vertical line test to determine if graphs are functions. This two-page worksheet contains 8 problems.
Curated OER
Linear Functions: Slope, Graphs, and Models
This math packet provides an opportunity for learners to graph two linear equations on a coordinate grid and determine the slope and y-intercept of each. They use the equation of five lines to find the slope and y-intercepts, and then...
School Mathematics Project
Resource Sheets
This extensive and far-reaching collection of worksheets puts a new twist on many basic concepts. Learners use multiplication to trace a path from one point to another, tile a plane by converting between improper and proper fractions,...
Curated OER
Graphing
In this graphing worksheet, students solve and graph 10 different problems that include determining various coordinates and the slope. First, they use the table to write the x and y coordinates for each point on the graphs. Then,...
Curated OER
Rise Over Run
In this rise over run learning exercise, students solve and complete 2 different problems that include determining the rise over run for a race ran. First, they use the information in the table to graph each person's performance using a...
EngageNY
Projecting a 3-D Object onto a 2-D Plane
Teach how graphic designers can use mathematics to represent three-dimensional movement on a two-dimensional television surface. Pupils use matrices, vectors, and transformations to model rotational movement. Their exploration involves...
EngageNY
How Do Dilations Map Lines, Rays, and Circles?
Applying a learned technique to a new type of problem is an important skill in mathematics. The lesson asks scholars to apply their understanding to analyze dilations of different figures. They make conjectures and conclusions to...
EngageNY
Vectors and the Equation of a Line
Represent linear equations in both two and three dimensions using parametric equations. Learners write parametric equations for linear equations in both two and three variables. They graph and convert the parametric equations to...
K-5 Math Teaching Resources
Graph Paper
You'll never have to buy graph paper again with this printable resource, which can be used for anything from creating graphs, plotting points in the coordinate plane, or measuring the area and perimeter of polygons. A helpful resource...
CK-12 Foundation
Evaluate Limits Using Graphs and Tables: Where Is That Limit?
Limits are made easy through graphs and tables. An easy-to-use interactive lets users change a function on a coordinate plane. They relate graphs and tables to the limit at a specific value.
Curated OER
Worksheet 13
In this math worksheet, middle schoolers write down the equation of a plane. Then they create the equation of a line. They also define the lines that are perpendicular.
Curated OER
The Power Steering Is Out?
Students use the point slope formula to calculate the slope and equation of a line. In this algebra lesson, students identify point on a coordinate plane using a robot. They differentiate between the different quadrants a they follow the...
Curated OER
Graphing Game
Students explore the concept of graphing ordered pairs. In this graphing ordered pairs lesson, students work in teams to play a version of Connect 4. Students use a Cartesian grid with values -4 to 4 as their Connect 4 board. Students...
Curated OER
Reading Graphs
Students plot functions on the Cartesian coordinate plane. They explore lines and parabolas. Students analyze graphs and answer questions about the information presented on the graph using an online program.


