Curated OER
Patterns of Settlement in Early Alabama
Fourth graders study the settlement of Alabama. They collect data from the U.S. census website and answer questions regarding settlement patterns in the counties of Alabama in 1820. They write a paagraph describing where they would have...
Curated OER
Bell Live! The Great Lakes: A Superior Adventure
Students participate in a virtual field trip to Lake Superior. In groups, they perform experiments in which test the level of toxins and bacteria in the water. They also watch video segments life in the lake and discuss their observations.
Curated OER
Helping Hands: Promoting Gloval Awareness
Eleventh graders explore Canadian support for foreign aide. In groups, 11th graders discuss Canadian aide policies and express their opinion of each. Students brainstorm methods of contributing to developing nations. They complete...
Curated OER
Making Sense of the Census
For this unit of lessons, students make sense of the census. They examine why a census is taken and participate in activities.
Curated OER
Discovering Demographics
Students analyze demographic data including a statistical overview of India. Students synthesize their findings and create an informational poster about India.
Curated OER
The Arctic and Taiga Ecozone of Canada
Students discover the differences in the Arctic and Taiga regions of Canada. They identify physical and human characteristics of both region. They also practice using an atlas.
Curated OER
The Arctic and Taiga Ecozone of Canada
Students examine the various sub-regions of the Arctic and Taiga zones in Canada. Using the online Canadian Atlas, they locate and describe the characteristics of each zone. They organize their information into a chart and share it with...
Curated OER
The Appaloosa - Horse of the Nez Perce
Fourth graders investigate the use of Appaloosa horses by the Nez Perce Native Americans during the War of 1877. They examine the geography of the area and determine why the Appaloosa horse was suited to this use after looking at...
Curated OER
People Movers
Students think about rapid transit systems and to design one for the kids in their own community. They start off with a discussion of the New York City subway system: why it was built, how it was built, how it changed the city.
Curated OER
A Canadian Inventory: The Way We Are!
Young scholars use the Canadian Atlas to discover an inventory of Canada's wealth and usage of resources. Using charts and graphs, they produce a wall of selected data of importance to the country and identify one issue of...
Curated OER
Where Should We Land?
Students discuss the difference between major landforms as a class. In groups, they rate the landforms based on the needs of the community that wish to settle there. They also discuss the push and pull factors of the colonists that made...
Association of Religion Data Archives
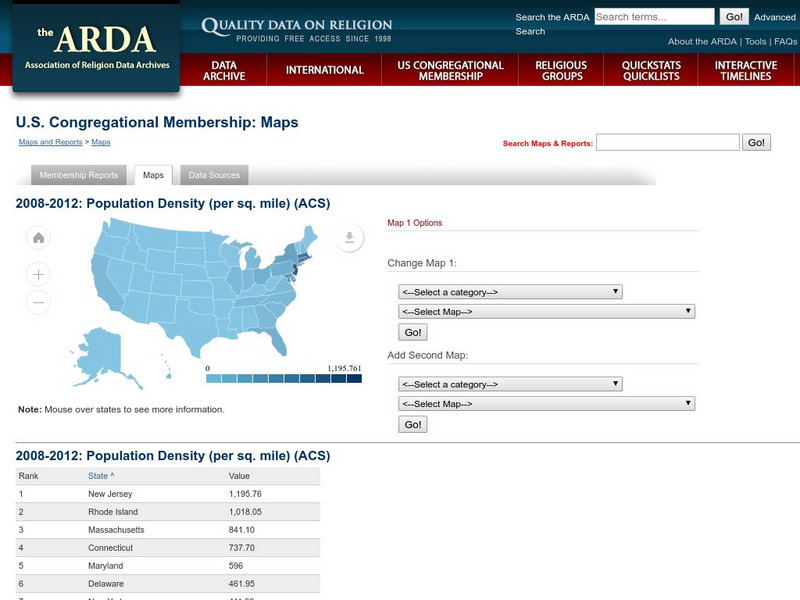
Association of Religion Data Archives: u.s. Population Density Map
Interactive tool that lets you choose a map (Census or Religion), then choose demographic or religious profiles to create a slideshow.
National Geographic
National Geographic: Population Density in the United States
Several factors contribute to the population trends across the United States. This lesson will explore maps to discover and understand these trends.
Curated OER
U. Of Texas: Sri Lanka: Ethnic Communities; Population Density; Land Use
Three great maps of Sri Lanka on one page. You can see the ethnic groups and religions on one map, the population density of the country on another, and the land use and economic activity on the third. From the Perry-Castaneda Collection
National Council of Teachers of Mathematics
Nctm: Illuminations: State Data Map
Data can be displayed in a variety of ways. This interactive map of the United States shows data by degrees of color. Choose to display data such as: land area, population, population density, gas use, and much more.
Geographypods
Geographypods: Theme 1: Population and Settlement
A rich collection of highly engaging learning modules on topics related to population and settlement. Covers six main areas - population growth, population change, population migration, land use, settlement characteristics and patterns,...
University of Richmond
Digital Scholarship Lab: Voting America: White Population Density, 1840 2000
This map shows population change among whites in US counties, 1840 to 2000. Each dot represents 500 people. Corresponding historical events and elections are included for each period of time.
University of Richmond
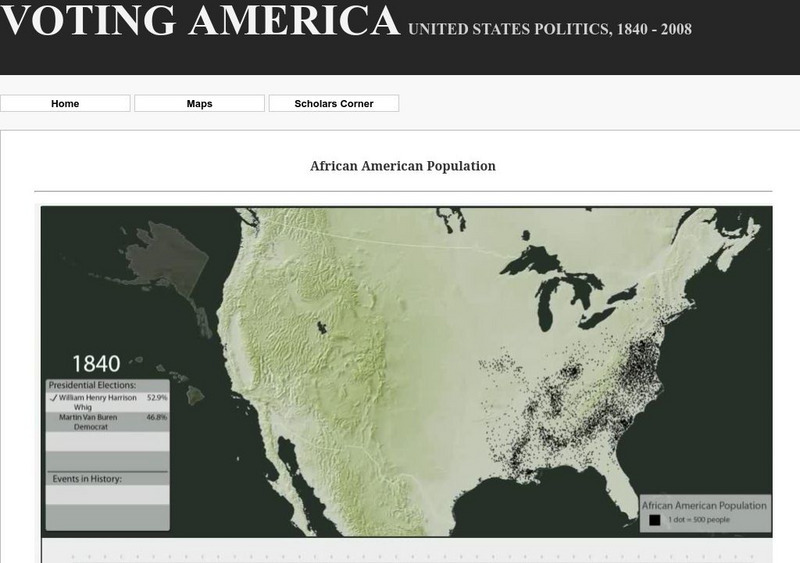
Digital Scholarship Lab: African American Population Density, 1840 2000
This interactive map shows the African-American population change in U.S. counties from 1840 to 2000. Each dot represents 500 people. Corresponding historical events are included for each period of time.
Curated OER
Map/still:population Density of Spain.
A map showing the population density of Spain from the online edition of Encyclopedia Britannica.
Other
Just Maps: World Maps
An index of maps and flags of countries throughout the world. Also provides political maps, time zones, population, and religious maps of every region of the world.
Curated OER
Etc: Maps Etc: Population Density Map of Europe, 1915
A map from 1916 of Europe showing the population density of the region at the time. This map is keyed to show areas of population densities ranging from under 2 inhabitants per square mile to areas of over 512 inhabitants per square mile.
Curated OER
Etc: Maps Etc: Population Density of South America, 1911
A map from 1911 of South America showing the population density across the region. The map is color-coded to show areas of population densities ranging from under 2 persons per square mile to over 256 persons per square mile. A chart at...
Curated OER
Educational Technology Clearinghouse: Maps Etc: Population Density of Asia, 1910
A map from 1910 showing the political boundaries and the distribution of population density of Asia at the time. This map uses gradated shading to shows areas of population densities ranging from under 2 inhabitants per square mile to...
Curated OER
Etc: Maps Etc: North American Population Density, 1910
A map from 1910 of North America, Central America, Greenland and the Caribbean showing population density distribution in the region at the time. The map is coded to show areas of population densities ranging from less than 1 inhabitant...


