Biblioteca Virtual Miguel de Cervantes
Biblioteca Virtual Miguel De Cervantes: Honduras
This resource site from Biblioteca Virtual Miguel de Cervantes in Spanish for the country of Honduras. The flag and a general map of the country are included. Of particular interest is the statistical data available on land size,...
Biblioteca Virtual Miguel de Cervantes
Biblioteca Virtual Miguel De Cervantes: Chile
This resource site from Bibliotica Virtual Miguel de Cervantes in Spanish for the country of Chile. The flag and a general map of the country are included. Of particular interest is the statistical data available on land size, climate,...
Biblioteca Virtual Miguel de Cervantes
Biblioteca Miguel De Cervantes: Republica Dominicana
This Bibliotica Virtual Miguel de Cervantes site in Spanish for the Dominican Republic provides a wealth of information, including the national flag, a map, holidays, and statistical data on land size, climate, population, life...
PBS
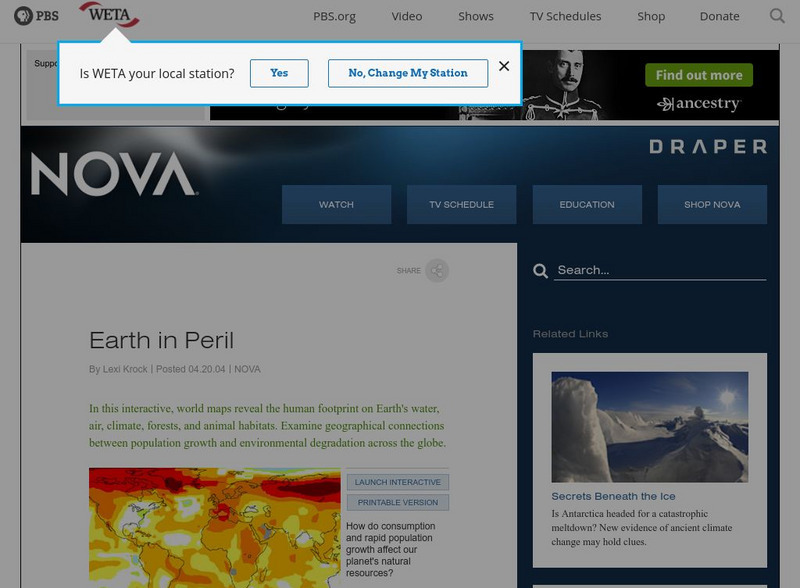
Nova: Earth in Peril
A series of nine maps with accompanying explanations. They show how population growth has affected the environment around the world in terms of water availability, climate change, land and forest use, and more. There are both interactive...
Curated OER
Educational Technology Clearinghouse: Maps Etc: Distribution of Population, 1820
A population map of United States and territories in 1820 showing the distribution of the European-American population at the time and the general tribal lands of the Native Americans east of the Mississippi River. The map shows the...
Curated OER
Educational Technology Clearinghouse: Maps Etc: Distribution of Population, 1830
A population map of United States and territories in 1830 showing the distribution of the European-American population at the time and the general tribal lands of the Native Americans east of the Mississippi River. The map shows the...
Curated OER
Educational Technology Clearinghouse: Maps Etc: American Population, 1790
A map of the original thirteen States in 1790 showing the distribution of the European-American population at the time and the general tribal lands of the Native Americans east of the Mississippi River. The map shows the State lines,...
Curated OER
Educational Technology Clearinghouse: Maps Etc: Population, 1840
A map of the central and eastern United States in 1840 showing the distribution of the population in the region at the time. The map shows State lines, the frontier line in 1840, and is keyed to show the areas of population density...
Curated OER
Etc: Maps Etc: Distribution of Population , 1850
A map of the United States showing the population distribution in 1850. The map is coded to show population densities ranging from under 2 inhabitants per square mile to over 90 inhabitants per square mile. The map illustrates the...
Curated OER
Educational Technology Clearinghouse: Maps Etc: Distribution of Population, 1790
A map of the original thirteen States in 1790 showing State lines, territories northwest and south of the Ohio River, British and Spanish possessions, and the distribution of the European-American population east of the Mississippi River...
Biblioteca Virtual Miguel de Cervantes
Biblioteca Virtual Miguel De Cervantes: Espana
This resource site in Spanish for the country of Spain. The flag and a general map of the country are included. Of particular interest is the statistical data available on land size, climate, population, life expectancy, infant mortality...
Biblioteca Virtual Miguel de Cervantes
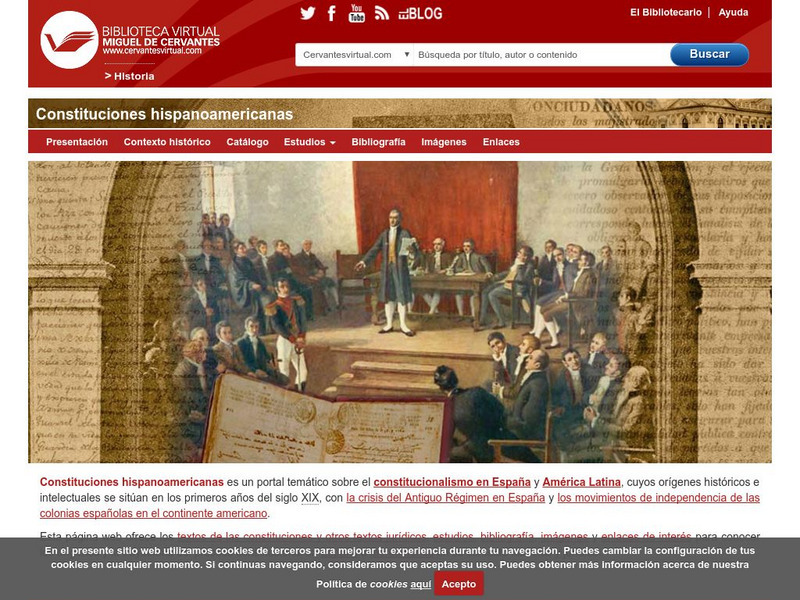
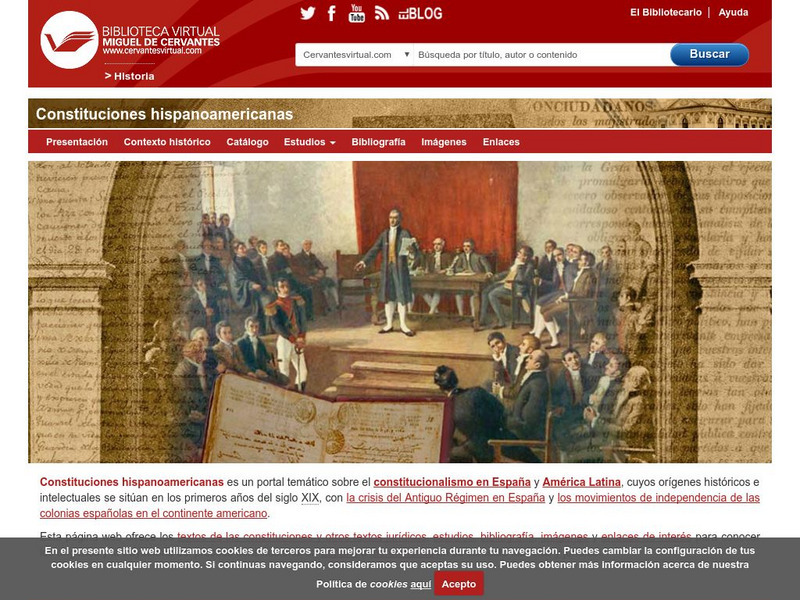
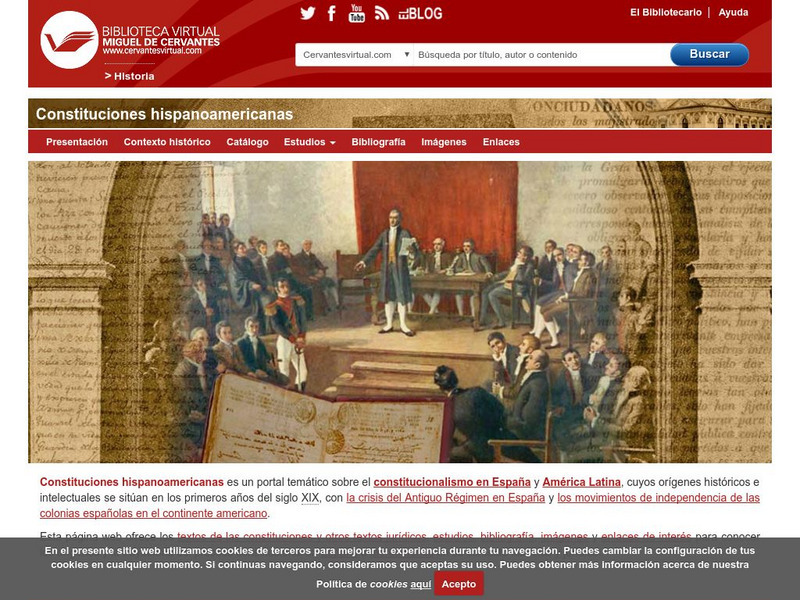
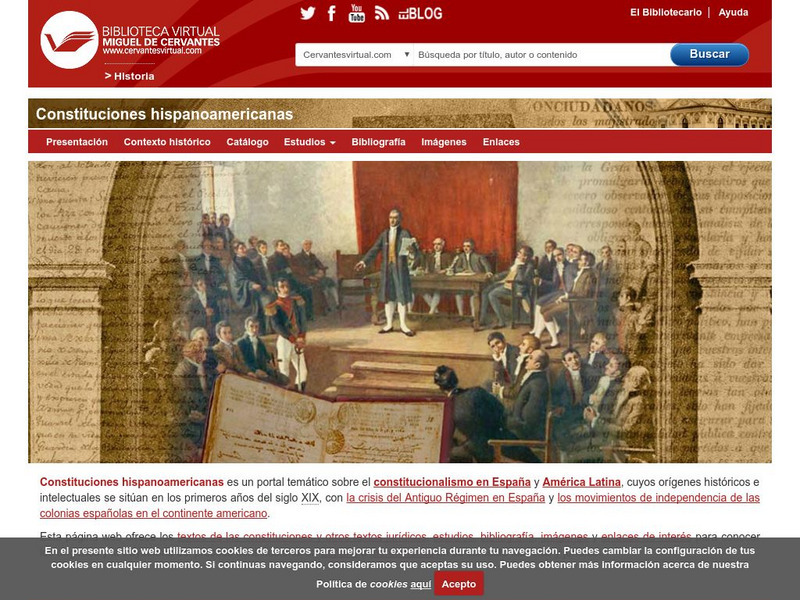
Constituciones Hispanoamericanas
Fascinating comparison of Spanish-speaking countries. Includes the flag and a general map of each country. Statistical data is provided for each country. Constitutional and government information is available for each country.
C3 Teachers
C3 Teachers: Inquiries: Geography
A learning module on world geography. It includes several supporting questions accompanied by formative tasks and source materials, followed by a summative performance task. Students investigate where their community is located, where...
Curated OER
Etc: Maps Etc: Density of Population in the u.s., 1901
A map from 1901 of the United States showing the population distribution at the time. The map is keyed to show areas of population densities ranging from sparse to very dense. This map is part of a classroom map study illustrating how,...
Curated OER
Etc: Maps Etc: Density of Population of Africa, 1915
A map from 1915 of Africa and Madagascar showing the population density of the region at the time. This map is keyed to show areas of population densities ranging from under 2 inhabitants per square mile to areas of over 512 inhabitants...
Curated OER
Etc: Australia Density of Population, 1915
A map from 1915 of Australia showing the population density of the region at the time. This map is keyed to show areas of population densities ranging from under 2 inhabitants per square mile to areas of over 128 inhabitants per square...
Curated OER
Etc: Maps Etc: The United States Population and Railroad Network, 1901
A map from 1901 of the United States showing population density, railroad lines, state capitals, and census centers of population at the time. The red figures indicate the mean population density per square mile for each state according...
Curated OER
Etc: Maps Etc: Europe Density of Population, 1910
A map from 1910 of population density in Europe, keyed to show area density ranges from under 2 to over 512 inhabitants per square mile, and cities with over 500,000 inhabitants.
Curated OER
Etc: Maps Etc: Africa Density of Population, 1910
Map showing the population density of Africa in 1910 measured in inhabitants per square mile. Cities with populations over 100,000 are shown.
Curated OER
Educational Technology Clearinghouse: Maps Etc: North America, Population, 1911
A map from 1911 of North America, Central America, Greenland, and the Caribbean to Puerto Rico showing the population distribution at the time. The map is color-coded to show population densities from under 2 persons per square mile to...
Curated OER
Etc: Maps Etc: Population Distribution of North America, 1916
A map from 1916 of North America, Central America, Greenland, and the Caribbean to Puerto Rico showing the population distribution at the time. The map is color-coded to show areas where the population density ranges from under 1...
Curated OER
Educational Technology Clearinghouse: Maps Etc: North China, 1971
" North China includes the densely populated and intensively cultivated North China Plain, the loess-covered uplands of Shansi, northern Shensi, and eastern Kansu, and the sparsely populated, semiarid steppes of Inner Mongolia....
Curated OER
Educational Technology Clearinghouse: Maps Etc: Population Distribution, 1860
A map of the central and eastern United States in 1860 showing the distribution of the population in the region at the time. The map shows State lines, the frontier line in 1860, and is keyed to show the areas of population density...


