Sophia Learning
Sophia: Sample: Lesson 17
This lesson introduces and defines the terms sample and population. It is 17 of 18 in the series titled "Sample."
University of Georgia
University of Georgia: Inter Math: Sample
This site gives a description of a sample (of a population). The page offers information on various types of sampling. There are links to related terms, everyday examples, more information, and the interactive check point involving...
Stefan Warner and Steven R. Costenoble
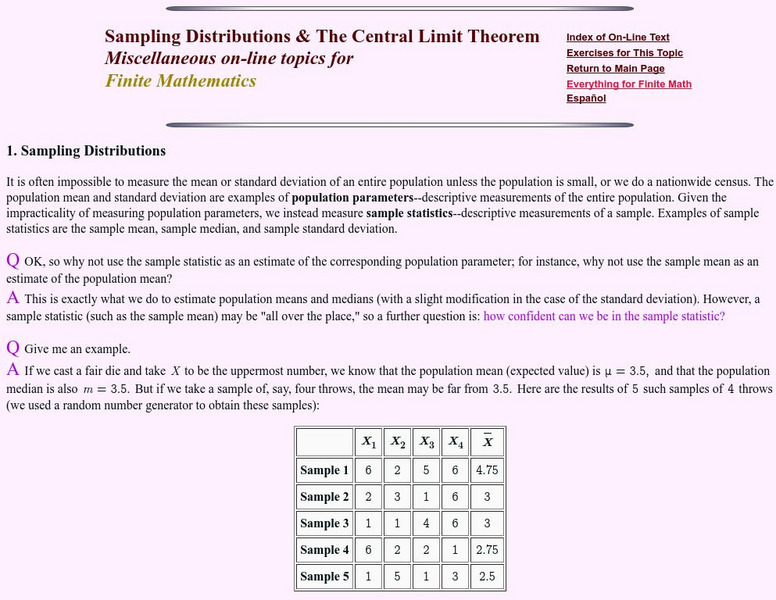
Finite Mathematics & Applied Calculus: Sampling Distributions and the Central Limit Theorem
Students learn about sampling distributions and the Central Limit Theorem. Topics explored are sample mean, population mean, and using the Central Limit Theorem. The tutorial investigates the statistics concepts through class notes and...
Texas Education Agency
Texas Gateway: Making Inferences/convincing Arguments About Samples/populations
Given problem situations that include given or collected data, the student will analyze the data and make inferences and convincing arguments based on the data.
Thinkport Education
Thinkport: Algebra Ii: Inferences
Focus on the development and collection of data, emphasizing the importance of simple random sampling.
University of Glasgow
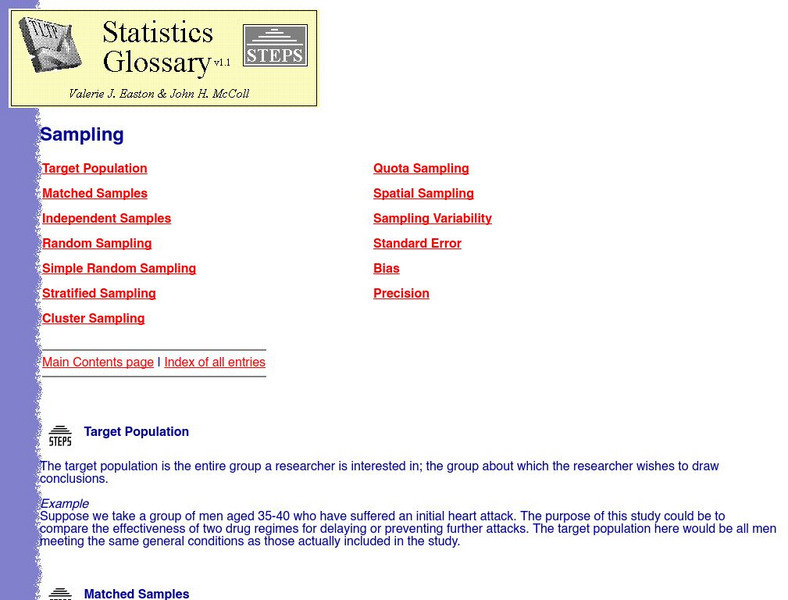
Statistics Glossary: Target Population
Go to this site for a brief definition for what the target population of a sample is along with an example problem.
PBS
Pbs Teachers: Scientific American: Deep Crisis: Salmon Counting
In this lesson, students can explore the techniques of census and population counting by inferring numbers of a virtual population illustrated within a rectangular sampling grid, and observing the accuracy of the technique in relation to...
PBS
Pbs Teachers: Something Fishy [Pdf]
Estimate the size of a large population (fish in a bay) by applying the concepts of ratio and proportion through the capture-recapture statistical procedure.
Web Center for Social Research Methods
Research Models Knowledge Base: Selecting Survey Method
Details the following issues that should be considered when selecting the survey method: population, sampling, questionnaire, bias, and administration.
Illustrative Mathematics
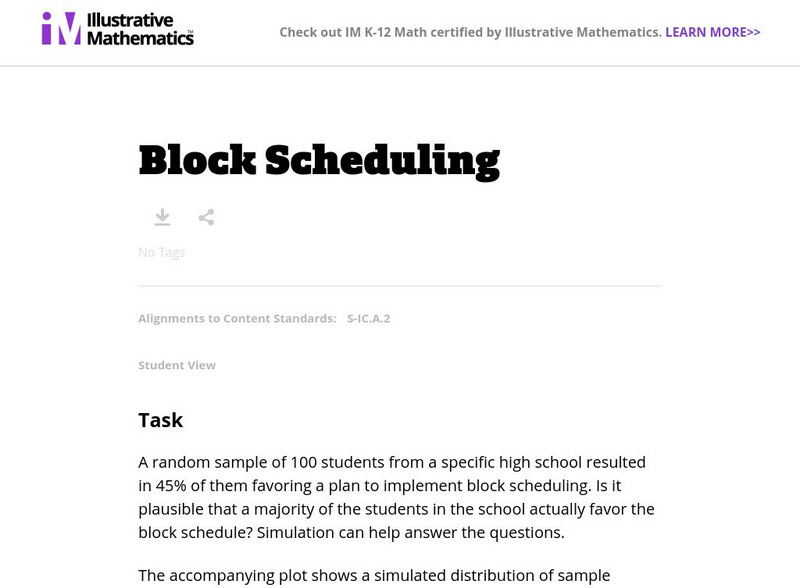
Illustrative Mathematics: S Ic Block Scheduling
A random sample of 100 learners from a specific high school resulted in 45% of them favoring a plan to implement block scheduling. Is it plausible that a majority of the students in the school actually favor the block schedule? Learners...
Common Core Sheets
Common Core Sheets: Statistics & Probability 7.sp.1 Worksheets
Create or print a worksheet to assess students' understanding of identifying populations and samples.
Science Education Resource Center at Carleton College
Serc: Mn Step: Worm Watch
For this field investigation, students use sampling techniques to identify the types of earthworms found in the schoolyard. Data will be combined for the whole class to get a snapshot of the earthworm population, species, and ecological...
CK-12 Foundation
Ck 12: Algebra Ii: 5.7 Margin of Error
This section introduces the concept of Margin of Error. Explore how results from surveys are most accurate within a range of values, and use this concept to make inferences about the preferences of a full population, given data from a...
Illustrative Mathematics
Illustrative Mathematics: s.ic.4 the Marble Jar
Sometimes hotels, malls, banks, and other businesses will present a display of a large, clear container holding a large number of items and ask customers to estimate some aspect of the items in the container as a contest. In some cases,...
Other
Statistics Education Web: Bubble Trouble [Pdf]
Use random sampling to formulate, collect, and compare data from two populations. Written by Peter Banwarth of Oregon State University.
Social Science Education Consortium
Ssec: Employment Unemployment: How Can Both Rates Rise at the Same Time? [Pdf]
In this investigation, learners are asked to explain a Wall Street Journal (WSJ) announcement about unemployment, and look for a contradiction in the message. Then they are introduced to the definitions of employment, unemployment, and...
Palomar Community College District
Palomar College: Hardy Weinberg Principle
This site from Palomar College describes the conditions needed for theHardy-Weinberg Principle to hold true.Completes sample calculations involvingthis principle.
TeachEngineering
Teach Engineering: Your River's Health
Students perform a macroinvertebrate survey to gauge the health of a local river. They collect water samples and count macroinvertebrates to learn how the health of a river's ecosystem can be determined by its river insect population.
Sophia Learning
Sophia: Creating a Good Survey and Analyzing the Results
In this activity, students will learn how to develop a sample survey while also using inferential statistics to solve real-world problems.
Texas Instruments
Texas Instruments: Numb3 Rs: Different or Not?
Based off of the hit television show NUMB3RS, this lesson has students examine cancer rates in population samples of the New England states to determine if the states' cancer rates are statistically similar. Hypothesis testing is...
Illustrative Mathematics
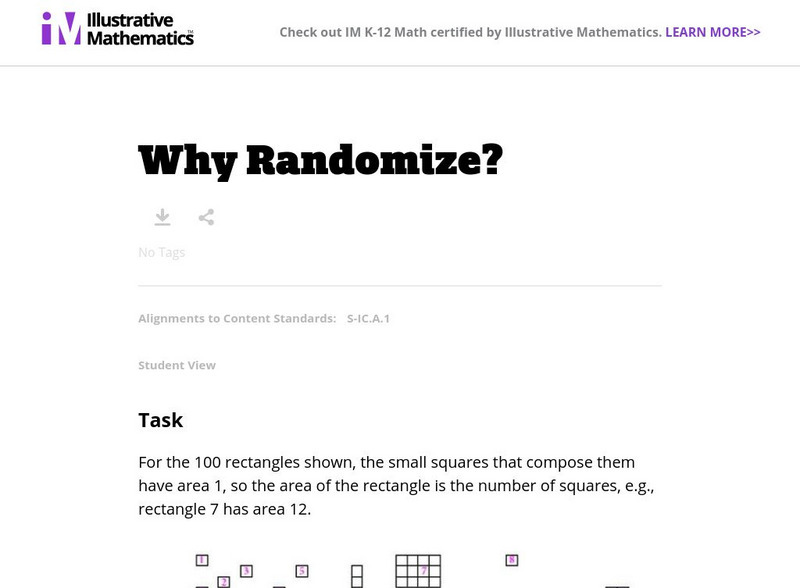
Illustrative Mathematics: S Ic Why Randomize?
The exercise demonstrates that judgment (non-random) samples tend to be biased in the sense that they produce samples that are not balanced with respect to the population characteristics of interest. Students will estimate the mean...
University of Cambridge
University of Cambridge: Maths and Sports: Who's the Best?
Can you use data from the 2008 Beijing Olympics medal tables to decide which country has the most naturally athletic population? This data-handling activity encourages mathematical investigation and discussion and is designed to be...
Illustrative Mathematics
Illustrative Mathematics: 7.sp Estimating the Mean State Area
The table below gives the areas (in thousands of square miles) for each of the lower 48 states. This serves as the population for this study. Your task involves taking small samples from this population and using the sample mean to...
The Wonder of Science
The Wonder of Science: Ms Ls2 1: Effects of Resource Availability
Work samples, phenomena, assessment templates, and videos that directly address standard MS-LS2-1: effects of resource availability.
Other popular searches
- Random Sampling Population
- Population Sampling Quadrat
- Sampling Animal Population
- Population Sampling Qua Drat
- Population Sampling Quiz
- Sampling Population
- Bat Population Sampling
- Natural Population Sampling
- Population Sampling Marine
- Science Sampling Population







![Statistics Education Web: Bubble Trouble [Pdf] Lesson Plan Statistics Education Web: Bubble Trouble [Pdf] Lesson Plan](https://content.lessonplanet.com/knovation/original/715465-988c4be74f96df36c2d9bcb6f2f5182f.jpg?1661829195)


