Curated OER
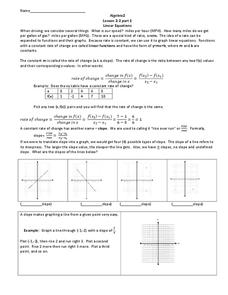
Linear Equations
Pre-algebra pupils examine the rate of change and how we can interpret it as a linear function. They are introduced to slope-intercept equations and graphs. Plenty of instruction is provided along with example problems. Note that even...
Curated OER
"You're Hired!'
Students investigate linear programming using the TI. In this algebra lesson, students collaborate and graph linear inequalities on a TI. They analyze their data and present it to the class.
Curated OER
Review for the Final Exam - College Prep Algebra
In this algebra review worksheet, students solve 100 open-ended and multiple choice problems. Students factor, simplify, graph, and solve inequalities, expressions, and equations.
Curated OER
Podcasting Parabolas
Students explore parabolas. In this algebra and technology lesson, students construct the equation of a specific parabola, then take digital photos of real-life representations of these parabolas. Students create a podcast with a...
Pace University
Grades 9-10 Algebra: Graphic Quadratics on the Coordinate Plane
Find quadratics in the world. Learners select ways to compare and contrast linear and quadratic functions and how to demonstrate knowledge of parabolas in the world. Teachers assign a third task challenging individuals to find equations...
Curated OER
Interpreting Graphs
Sixth graders interpret linear and nonlinear graphs. They create graphs based on a problem set. Next, they represent quantitive relationships on a graph and write a story related to graphing.
Curated OER
I Can Do This! Systems of Equations
Students solve systems of 2-by-2 linear equations using tables,
graphs and substitution. In small groups, classmates work together to discover strategies for solving equations. They use a calculator to graphically represent their answers.
Curated OER
Investigating Linear Equations Using Graphing Calculator
Students investigate linear equations using the Ti-Calculator. In this algebra lesson, students graph lines and identify the different quadrants on a coordinate plane. They identify ordered pairs used to plot lines.
Curated OER
Inequalities 7.3
Graph inequalities and discuss the difference in their slopes. Learners observe rate of change as they compare linear, quadratic, and cubic functions.
Los Angeles County Office of Education
Assessment for the California Mathematics Standards Grade 7
In need of an all-inclusive seventh grade math resource? Packed full of the topics necessary for Pre-Algebra the packet includes practice problems with different difficulty levels. It works great for any supplemental use needed in the...
Curated OER
Transformations in the Coordinate Plane
Your learners connect the new concepts of transformations in the coordinate plane to their previous knowledge using the solid vocabulary development in this unit. Like a foreign language, mathematics has its own set of vocabulary terms...
Curated OER
Graphing Linear Inequalities
Eighth graders extend skills for representing and solving linear equations to linear inequalities. Lesson activities build understanding and skill by plotting ordered pairs of numbers that either satisfy or do not satisfy a given...
Del Mar College
Quick Reference Card
A neat and organized formula handout makes the circle go round, doesn't it? Full of higher algebra topics, formulas and rules, graphs and definitions—there is a way to support everyone in Algebra II or Pre-Calculus.
Texas Instruments
TI-Nspire™ CAS
When it comes to rating educational calculators, this calculator is always near the top of this list. Now it's available as an app. There is a lot of calculator power wrapped up in this app. Not only is this a fully functioning...
Curated OER
Is there Treasure in Trash?
More people, more garbage! Young environmentalists graph population growth against the amount of garbage generated per year and find a linear model that best fits the data. This is an older resource that could benefit from more recent...
Shodor Education Foundation
InteGreat
Hands-on investigation of Riemann sums becomes possible without intensive arithmetic gymnastics with this interactive lesson plan. Learners manipulate online graphing tools to develop and test theories about right, left, and midpoint...
Curated OER
Hit Me If You Can!
Students graph linear equations using slopes and intercepts. In this algebra lesson, students identify the slope as being positive,negative or undefined. They differentiate between different quadrants on a coordinate plane.
Curated OER
Equations Lesson Plan
Seventh graders play "What's my Rule" beginning with simple equations and working towards harder problems as student's gain confidence. They evaluate the equations by graphing them. Students identify the slope and y intercepts of the...
Curated OER
How High Are the Clouds?
Learners analyze height and collect data to create a graph. In this statistics lesson, students use central tendencies to analyze their data and make predictions. They apply concept of statistics to other areas of academics to make a...
Curated OER
Properties of Logarithms
Students explore the concept of logarithms. In this logarithms lesson, students discuss the logarithm properties. Students use linear functions as a basis to develop the logarithm properites by substituting log b and log a for x and y.
Curated OER
Let's Go Slopey
Students create a table of values to graph a line. In this algebra instructional activity, students identify the slope and intercept of a linear equation. They use a Ticalculator to graph their function.
Alabama Learning Exchange
Add, Subtract, and Multiply Matrices
Introduce the concept of matrices with a pre-designed instructional activity. Learners watch video lessons to learn the ins and outs of adding, subtracting, and multiplying matrices. Using provided problems, they practice each operation...
Texas Instruments
TI-Nspire™
We landed on the moon with less computing capabilities than you can find in this app! Here is a multiple function calculator that takes all the power you get from a handheld and adds the wonderful large screen that only a tablet can...
Curated OER
Slope
Students calculate the slope of a line. In this slope lesson, students use a graph, an equation or two points to help them calculate the slope of a line. They differentiate between a slope of zero and an undefined slope.


