Virginia Department of Education
Curve of Best Fit
Which function models the data best? Pupils work through several activities to model data with a variety of functions. Individuals begin by reviewing the shapes of the functions and finding functions that will fit plotted data points. By...
Santa Monica College
Lewis Structures and Molecular Shapes
Learners practice drawing Lewis dot structures, build molecules with model kits, and predict molecular shapes using VSEPR theory. The combination of written work and hands-on reinforcement benefits young scientists.
International Technology Education Association
Become a Weather Wizard
Accurate weather forecasting is something we take for granted today, making it easy to forget how complex it can be to predict the weather. Learn more about the terms and symbols used to forecast the weather with an earth science lesson...
Beyond Benign
The Big Melt: Arctic Ice Caps
Are the Arctic ice caps really melting out of existence? Junior climatologists examine the statistics of ice decline through four math-based lessons. Each activity incorporates data, climate information, and environmental impact into an...
Science Matters
Formative Assessment #2
Learners work collaboratively to predict what life would be like as an Arctic Hare. Teams go on a hunt where scholars role play an owl, white hares, and gray hares. Independently, pupils record their findings and reflect on their...
Howard Hughes Medical Institute
Ocean Acidification
Human impacts on the environment can sometimes be difficult to measure, especially under water! An activity centered on ocean acidification gives science scholars the opportunity to examine the effects of carbon dioxide on marine life....
101 Questions
What Micheal’s Coupon Should You Use?
Get your classes on their way to extreme couponing! Young mathematicians analyze two different coupon options for the better deal. They use different scenarios to predict and compare the outcomes.
Film Education
Nineteen Eighty-Four: Orwell
Warning or prediction? Nineteen Eighty Four is the anchor text for a series of tasks that ask readers to compare the novel to the film as well as current events to those pictured in George Orwell's dystopian classic.
101 Questions
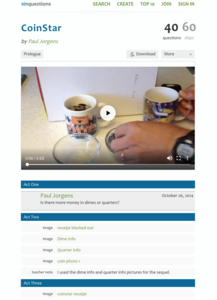
CoinStar
Would you rather have a bowl of dimes or a bowl of quarters? A video introduces the problem by presenting two bowls, one full of quarters and another full of dimes. Learners use information from a CoinStar receipt to calculate the number...
Tidewater Community College
Assignment: The “Big Mac” Index
Young economists learn about the method of predicting changes in the exchange rate with Big Macs in an instructional video. After an understanding the index, learners write a post on a discussion board and respond to class members' posts...
PBS
PBS Electoral Decoder
Imagine being able to explore all the presidential elections from 1789-2016! Being able to examine the key events, how the states voted, and the importance of the Electoral College in each of the elections! A PBS cartogram makes all this...
Curated OER
Green Leaves
Third graders, after having conducted one experiment three times, record their observations results in a chart. They predict what hidden colors they believe that a leaf holds. Students record their predictions in their science note books...
Curated OER
A Weekend with Wendell
Students discuss the term prediction. In this language arts lesson, students predict what will happen next by using the turn & talk strategy. Students chart the predictions each one makes.
Curated OER
Chances Are: Talking Probability
Students explore probability and the process of data analysis and predictions. They participate in two activities, one involving a calculator and one the Internet, in which they make predictions and conduct activities to test their...
Curated OER
Using Energy Resources Wisely
Students discuss energy resources. In this energy lesson, students predict which item: the plastic cup, metal soup can, or foam cup, will keep water warm for the longest time by measuring the temperature in each item every minute for 15...
Curated OER
Collecting Data
Fifth graders collect and describe data. Through various inquires, they collect information and describe it in graph form. Students predict information, find the actual amount based on their data and compare their findings with their...
Curated OER
Record 'The' Results
Third graders predict how many times they'll see the word "the" in a newspaper page and highlight all the "the"s they find. After reviewing definitions of range, median, mode, mean they create a Stem and Leaf Plot and a Back-to-Back Stem...
Curated OER
Magazine Madness
Young scholars look at pictures cut out of magazines to determine what is happening in the picture and predict what will happen next.
Curated OER
Opposites
First graders take a picture walk through of the big book "Moonbear's Books" and make predictions on what they think is happening. Echo read to check predictions. Students generate words that are opposites on chart paper.
Curated OER
The Legend of Sleepy Hollow
Fourth graders read The Legend of Sleepy Hollow aloud, make predictions, compare characters, discuss plot and setting, and rewrite the ending to the story.
Curated OER
Is it Partly Cloudy or Partly Sunny?
Students investigate the concept of weather and how it is created. They review relevant vocabulary related to weather. Students predict weather given slight background knowledge. The lesson plan includes background information for the...
Curated OER
The Medium is the Message: Covering the Final Chapter of the Elian Gonzalez Story
Learners discuss the case of Elian Gonzalez and collaborate in small groups to act as editors in assigning facts, quotes, and details to be included in a newspaper article. They judge the accuracy of their predictions.
Curated OER
Ohio Census 1990 & 2000
Students use Ohio census data to solve problems, make comparisons, draw conclusions, and support predictions related to Ohio's population. They interpret and work with pictures, numbers and symbolic information.
Curated OER
Health and Physical Education
Second graders read the story, Just a Minute. They create books with physical activities listed. They predict how many times they can perform that activity in one minute.
Other popular searches
- Making Predictions
- Predictions
- Predicting Outcomes
- Reading Predicting Outcomes
- Reading Making Predictions
- Make Predictions
- Pictures Story Predictions
- Lesson on Making Predictions
- Reading Predictions
- Story Prediction
- Predicting a Story


