EngageNY
The Difference Between Theoretical Probabilities and Estimated Probabilities
Flip a coin to determine whether the probability of heads is one-half. Pupils use simulated data to find the experimental probability of flipping a coin. Participants compare the long run relative frequency with the known theoretical...
University of Nottingham
Modeling Conditional Probabilities: 2
Bring the concept of conditional probability alive by allowing your classes to explore different probability scenarios. Many tasks have multiple solutions that encourage students to continue exploring their problems even after a solution...
Curated OER
Modeling Conditional Probabilities 1: Lucky Dip
Check out this detailed lesson plan on conditional probability! Learners work individually and also collaboratively to analyze the fairness of a game and justify their reasoning. it includes detailed notes and many helpful suggestions...
Curated OER
Probability- Many Stage Experiments
Students list the sample space of an experiment. In this statistics lesson, students calculate the number of favorable outcome in a given sample space. They define and apply mutually exclusive events versus not mutually exclusive events.
Curated OER
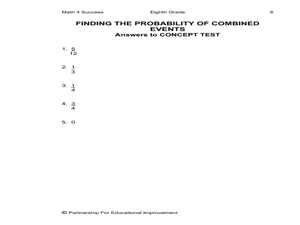
Finding the Probability of Combined Events
Eighth graders investigate the probability of combined events. For this eight grade probability lesson, 8th graders use a sample space, two events, and their intersections to determine the probability of each event, their intersection,...
Curated OER
Probability Math Game
Ninth graders investigate probability through games. In this probability instructional activity, 9th graders discuss sample space and distribution. They collect and analyze data using graphing.
Curated OER
Data Analysis and Probability Race to the Finish
Students practice addition facts, record data, and construct a bar graph. In this probability instructional activity, students participate in a board game in which bicycles move towards a finish line based on players completing addition...
American Institutes for Research
Data and Probability: Marshmallow Madness
Upper grade and middle schoolers make predictions, collect data, and interpret the data as it relates to the concept of probability. They work with a partner tossing marshmallows and recording if they land on their side or on their...
Curated OER
Do You Feel Lucky?
Students explore probability by using games based on probable outcomes of events. They name all of the possible outcomes of an event and express the likelihood of such an event occurring.
Curated OER
Investigation--What Are My Chances?
Seventh graders investigate theoretical and experimental probability by conducting a series of experiments with multiple trials, comparing results, combining results and making conclusions. They express probabilities as fractions,...
EngageNY
Chance Experiments with Outcomes That Are Not Equally Likely
The fifth portion of the 25-part series introduces probabilities calculated from outcomes that are not equally likely. Class members use tables to calculate probabilities of events, add outcome's probabilities, and find complements....
Bowland
Explorers – Patrol Services
Far out — plan a trip to space! Aspiring mathematicians steer a space vehicle through an asteroid field, calculate currency exchanges to buy provisions, and determine placement of charges to blow up asteroids. Along the way, they learn...
American Statistical Association
A Sweet Task
Candy is always an effective motivator! A fun math activity uses M&M's and Skittles to explore two-way frequency tables and conditional probability. The candy can serve a dual purpose as manipulatives and experimental data.
Curated OER
The Probability Scale
Learners collect data and make predictions. In this probability lesson, students perform experiments calculating the chance of an event occurring. They draw conclusion based on their data.
Curated OER
Sampling Snoops
Students practice formulating a hypothesis and designing an experiment to test the hypothesis. They identify several sampling techniques they can use to test their hypotheses.
Virginia Department of Education
What Are the Chances?
Take a chance on an informative resource. Scholars conduct probability experiments involving coins and number cubes to generate data. Compiling class data helps connect experimental probability to theoretical probability.
Alabama Learning Exchange
Bear Factory Probability
By examining a set of dice roll data, statisticians determine the probability of different sums occurring. They visit an interactive website and determine how many different vacation outfits Bobbie Bear will have based on the colored...
Curated OER
Calculating Buttons
Students, after reading "The Button Box" by Margarette S. Reid, analyze real-world data by surveying a sample space. They predict the generalization onto a larger population utilizing calculators and computers. Students total categories,...
Alabama Learning Exchange
Pennies, Pennies and More Pennies
Learners determine the number of pennies needed to fill a room. In this pennies lesson plan, learners work in groups to determine the number of pennies needed to fill a room. They compute the probability of the head of a pin landing on...
Curated OER
Probability Distributions
Students collect and plot data on a graph. In this statistics instructional activity, students analyze the distribution of a sample and predict the outcome. They find the line of best fit and discuss what would make the sample larger.
Curated OER
Lucky 7s
This helpful lesson explores the probability in tossing a coin and throwing dice. Specifically, it looks at the probability of getting numbers that are significant to the game of craps, assuming that once the math is understood, most...
EngageNY
Discrete Random Variables
You don't need to be discreet about using the resource on discrete variables. In the fifth installment of a 21-part module, scholars explore random variables and learn to distinguish between discrete and continuous random variables. They...
Statistics Education Web
When 95% Accurate Isn’t
Investigate the effect of false positives on probability calculation with an activity that asks scholars to collect simulated data generated by a calculator. To finish, participants analyze the probability of certain outcomes which lead...
EngageNY
Events and Venn Diagrams
Time for statistics and learning to overlap! Learners examine Venn Diagrams as a means to organize data. They then use the diagrams to calculate simple and compound probabilities.


