Curated OER
Frequency Tables
Seventh graders construct frequency tables and box-and-whisker plots. After constructing tables and plots, they take a quiz on mean, median, mode, range, scientific notation, and number properties.
Curated OER
Graphing Functions
In this graphing functions worksheet, 11th graders solve and complete 10 different types of problems. First, they graph each function and list the asymptote, domain and range for each. Then, students sketch each graph. They also draw and...
Curated OER
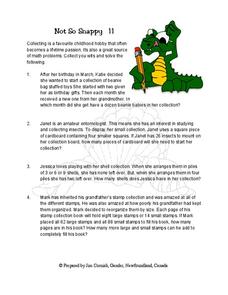
Not So Snappy 11
In this word problem worksheet, students discover a creative way to practice math word problems - through childhood hobbies. With four word problems each ranging from collecting beanie bags, insects, shells, and stamps any student can...
Raytheon
Equations and Graphing Review
In this equations and graphing review instructional activity, learners write, graph and solve equations for 62 problems, including a mid-unit review, with answers included.
Curated OER
Properties of Trigonometric Functions
In this properties of trigonometric functions worksheet, students complete 4 sections consisting of 15 problems involving problem solving using Pythagorean and trigonometric identities and sketching functions..
Curated OER
Inverse Relationships (E)
In this inverse addition and subtraction worksheet, students examine 30 pairs of addition and subtractions sentences. Students use their problem solving skills to fill in the blanks boxes with the appropriate numbers.
Curated OER
Inverse Relationships Addition/Subtraction (A)
In this inverse relationships worksheet, students problem solve and calculate the answers to sixteen mathematical equations involving addition and subtraction.
Noyce Foundation
Parallelogram
Parallelograms are pairs of triangles all the way around. Pupils measure to determine the area and perimeter of a parallelogram. They then find the area of the tirangles formed by drawing a diagonal of the parallelogram and compare their...
California Education Partners
Cady's Cats
How much can a cat eat? The five-question fraction assessment asks pupils to determine the fractional portion of a food box eaten by cats. Learners show their proficiency in adding and subtracting fractions using several scenarios...
American Statistical Association
Bear Hugs
Scholars research arm span to determine who gives the best bear hugs. They use data from a national study to find the standard statistics for arm span. It includes mean, median, quartiles, spread, standard deviation, and more.
American Statistical Association
Tell it Like it is!
Scholars apply prior knowledge of statistics to write a conclusion. They summarize using correct academic language and tell the story of the data.
California Education Partners
Summer Olympics
Quickly get to the decimal point. The last assessment in a nine-part series requires scholars to work with decimals. Pupils compare the race times of several athletes and calculate how much they have improved over time. During the second...
California Education Partners
Bake Sale
Work with fractional cookies. The three-part assessment task checks the pupils' ability to find the product of fractions and whole numbers, mixed numbers, or fractions. Learners determine the amount of ingredients needed and how many of...
California Education Partners
Soccer Snacks
Make the cookies healthy. The assessment task asks pupils to determine the number of cookies they could make based on a given amount of ingredients. Given two sugar substitutes, learners determine which substitute would be better and...
American Statistical Association
How Fast Are You?
Quick! Snap up the instructional activity. Scholars first use an online app to collect data on reaction times by clicking a button when the color of a box changes. They then plot and analyze the data by considering measures of center,...
Virginia Department of Education
Linear Curve of Best Fit
Is foot length to forearm length a linear association? The class collects data of fellow scholars' foot length and the length of their forearms. They plot the data and find a line of best fit. Using that line, they make predictions of...
Mascil Project
Closed Greenhouses
Controlling the efficiency of a greenhouse is a mathematical task. A collaborative project challenges learners to create an efficiency plan for a closed greenhouse. Using algebraic equations, they consider a set of constraints, design...
American Statistical Association
Armspans
Young mathematicians collect data on the arm spans of classmates. Then they sort the data by measures of center, spread, and standard deviation. Finally, they compare groups, such as boys and girls, to interpret any differences.
Open Text Book Store
Arithmetic for College Students: Worksheets
Loaded with concepts ranging from multiplying decimals to converting units to solving problems using the order of operations, a thorough practice packet is perfect for a fifth or sixth grade math classroom.
Institute of Electrical and Electronics Engineers
Spring Scale Engineering
After examining how a spring scale works, teams work together to design their own general measurement device. Reading material provides background information, but there is no part of the procedure in which learners handle an actual...
Curated OER
Volume Review
Learners investigate the concepts of volume for rectangular prisms and spheres. They measure the volume of one balloon and then consider how many breaths it would take to fill the room with balloons. The rectangular prism being measured...
Curated OER
Line Plots - Homework 6.3
Elementary schoolers use data in a table to make a line plot, then answer five related questions. Houghton Mifflin text is referenced.
Wake Forest University
Authentic Activities for Connecting Mathematics to the Real World
Check out the handout from a presentation that contains a collection of high school algebra projects connecting a variety of mathematics to the real world. Activities range from simple probabilities to calculus. The activities can be...
Curated OER
Counting: Skip Counting
In this skip counting worksheet, students solve 10 problems that require them to skip count as indicated in the instructions for each problem set. Students fill in 9 blanks in each set. The range of numbers on this worksheet is 1-102.


