Curated OER
Hyperbolas: Sketching from the Equation
In this algebra worksheet, students sketch graphs of hyperbolas after solving equations to standard form and interpreting the center, vertices, foci, axis, asymptotes, and eccentricity from the equation. There are 58 questions.
Curated OER
Roman Bernardo: Solving Linear Equations
Mathematicians use an inquiry method to solve linear equations. In this linear equations instructional activity, students practice solving equations using addition, subtraction, multiplication and division. They solve multi-step...
Happy Maau Studios
Math Ref
Forgot how to multiply matrices? Well, this app can help. It is like a gigantic, well-organized reference card for all things math. Customize your personal reference material by adding your own notes and build up a personalized list of...
Achieve
Ivy Smith Grows Up
Babies grow at an incredible rate! Demonstrate how to model growth using a linear function. Learners build the function from two data points, and then use the function to make predictions.
Curated OER
Dental Impressions
What an impressive task it is to make dental impressions! Pupils learn how dentists use proportional reasoning, unit conversions, and systems of equations to estimate the materials needed to make stone models of dental impressions....
Inside Mathematics
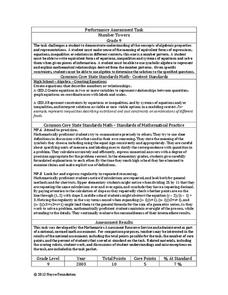
Number Towers
Number towers use addition or multiplication to ensure each level is equal. While this is common in factoring, it is often not used with algebraic equations. Solving these six questions relies on problem solving skills and being able to...
Radford University
Sleep and Teen Obesity: Is there a Correlation?
Does the number of calories you eat affect the total time you sleep? Young mathematicians tackle this question by collecting their own data and making comparisons between others in the class through building scatter plots and regression...
Virginia Department of Education
Linear Curve of Best Fit
Is foot length to forearm length a linear association? The class collects data of fellow scholars' foot length and the length of their forearms. They plot the data and find a line of best fit. Using that line, they make predictions of...
Curated OER
Numerical Analysis/ Examples of Round Off Errors
In this math instructional activity, students practice computing the errors for rounding off and use the skill of analysis to find the true solutions.
Curated OER
Theorems About Roots and Polynomial Equations
In this algebra worksheet, students solve polynomial equations using factoring. They identify the roots of the equations. There are 3 questions with an answer key.
Curated OER
Complex and Imaginary Numbers
In this complex and imaginary numbers worksheet, students multiply and divide imaginary and complex numbers. They solve equations containing imaginary numbers. Students determine the roots, sum and product of the roots and the roots of...
Curated OER
Numerical Analysis: Nonlinear Equations
In this nonlinear equations worksheet, students use iterative methods for solving systems of nonlinear equations. This four-page worksheet contains eight multi-step problems.
Curated OER
Sixty-Eight Solving Equations and Performing Operations With Complex Numbers
In this complex numbers worksheet, students classify numbers, perform operations on complex numbers, and find complex solutions to equations, in sixty-eight problems.
Curated OER
Annual Wetland Plant Diversity Survey
Students locate an area of marsh and, by measuring the total number of individual plants in a sample area, determine whether purple loosestrife population density is correlated to the total plant diversity of the community. They...
Curated OER
Maximize It!
Students design a rectangular box without a lid that has the largest possible volume using the supplied sheet of centimeter graph paper. They work in groups to construct different size boxes to determine the largest possible volume and...
Curated OER
Celsius to Fahrenheit
Students convert degrees between two different units. In this algebra instructional activity, students graph linear equations and identify the line of best fit. They use their line of best fit to make predictions given a set of data.
Curated OER
e, pi, and Exponential Functions
Students investigate e, pi and exponents. In this calculus lesson, students define constants and non-constants using, pi, e and exponents as an example. They use the TI to work the problems in this lesson.
Curated OER
TI-89 Activities for PreCalculus and AP Calculus
Using the TI-89 calculator, young scholars explore the statistical, graphical and symbolic capabilities of the TI-89. Students investigate topics such as solving systems of equations, finding inverse functions, summations, parametrics...
Curated OER
Math Regents Exam Questions: Graphing Rational Functions
In this graphing rational functions worksheet, students answer 18 multiple choice problems about rational functions. Students determine values for a which a function is undefined given the equation of the function.
Curated OER
Growing Circles
High schoolers identify the equation to represent a circle. In this algebra lesson, students review properties of conics and how they are related. they use a robot to create a visual of circles and their application to the real world.
Curated OER
Numerical Analysis
In this math worksheet, students practice analyzing iterative methods. Then they use the reading to practice problem solving focusing upon convergence.
Curated OER
Conjectures and Conclusions
Young scholars draw conclusions and make conjectures given a specific scenario. In this geometry activity, students model real life scenarios using properties of triangles. They model number facts and explain why the outcome is what it is.
Curated OER
Functions and the Vertical Line Test
Students explore the concept of functions. In this function lesson, students determine if the graph is a function by using the vertical line test. Students use an applet to explore the vertical line test on a variety of graphs.
Curated OER
Means of Growth
Students collect and graph data. In this statistics lesson plan, students analyze their plotted data using a scatter plot. They identify lines as having positive, negative or no correlation.
Other popular searches
- Math Quadratic Formula
- Quadratic Formula Project
- Derive the Quadratic Formula
- Algebra Quadratic Formula
- Algebra Quadratic Formula
- Using Quadratic Formula
- Solving Quadratic Formula
- Factoring Quadratic Formula
- Deriving the Quadratic Formula
- Finding Quadratic Formulas
- Discriminant Quadratic Formula
- The Quadratic Formula


