Khan Academy
Khan: Lsn 8: Interpreting Relationships in Scatterplots/graphs/tables/equations
This instructional activity focuses on Interpreting and analyzing linear, quadratic, and exponential models and graphs. Students will use best fit lines to interpret contexts, distinguish whether contexts are linear or exponential...
Texas Instruments
Texas Instruments: Inequalities, They Are Not Just Linear Anymore!
Students study quadratic relationships and explore the process of graphing quadratic inequalities and systems of quadratic inequalities. They will solve these inequalities algebraically and graph them on a coordinate plane.
Other
Desmos: Will It Hit the Hoop?
Students explore projectile motion in this activity as they look at videos and predict whether basketballs will land in the hoop. They then show their predictions in graphs of parabolic curves and compare their predictions to the actual...
Khan Academy
Khan Academy: Equations & Inequalities Word Problems
HSA-CED.A.1: Interactive resource which create equations and inequalities in one variable and use them to solve problems. Include equations arising from linear and quadratic functions, and simple rational and exponential functions....
Texas Education Agency
Texas Gateway: The Language of Physics: Physical Quantities and Units
By the end of this section, you will be able to associate physical quantities with their International System of Units (SI) and perform conversions among SI units using scientific notation; relate measurement uncertainty to significant...
Illustrative Mathematics
Illustrative Mathematics: S Id.6 Used Subaru Foresters
Help Jane sell her Forrester! Using the data given, students will make an appropriate plot with well-labeled axes that would allow you to see if there is a relationship between price and age and between price and mileage. Students are...
ClassFlow
Class Flow: Equations
[Free Registration/Login Required] Students interpret algebraic equations and inequalities geometrically and describe geometric relationships algebraically.
National Institute of Standards and Technology (NIST)
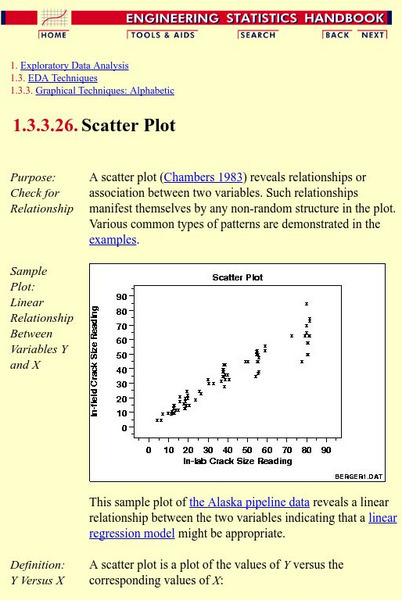
Nist: Engineering Statistics Handbook: Scatter Plots and Linear Regression
An explanation of scatter plots followed by examples of the many different kinds of scatter plots.
Illustrative Mathematics
Illustrative Mathematics: F if a Sse Modeling London's Population
In this task, learners are shown a table of population data for the city of London and are asked to explore whether a linear, quadratic, or exponential function would be appropriate to model relationships within the data. They are next...


