Science Education Resource Center at Carleton College
Serc: Reese's Pieces Activity: Sampling From a Population
Students use Reese's Pieces to investigate the proportion of orange candies present in a set of 25. After collecting data for the class, they use a web applet to collect more data for random samples. This is compared to the actual...
Sophia Learning
Sophia: Sampling: Lesson 4
This lesson will introduce the process of sampling. It is 4 of 7 in the series titled "Sampling."
University of Georgia
University of Georgia: Inter Math: Sample
This site gives a description of a sample (of a population). The page offers information on various types of sampling. There are links to related terms, everyday examples, more information, and the interactive check point involving...
Illustrative Mathematics
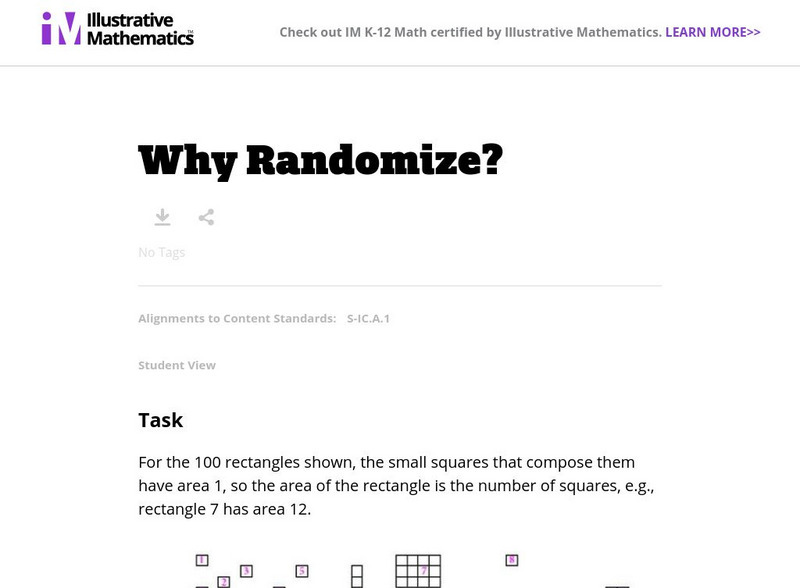
Illustrative Mathematics: S Ic Why Randomize?
The exercise demonstrates that judgment (non-random) samples tend to be biased in the sense that they produce samples that are not balanced with respect to the population characteristics of interest. Students will estimate the mean...
Thinkport Education
Thinkport: Algebra Ii: Inferences
Focus on the development and collection of data, emphasizing the importance of simple random sampling.
Illustrative Mathematics
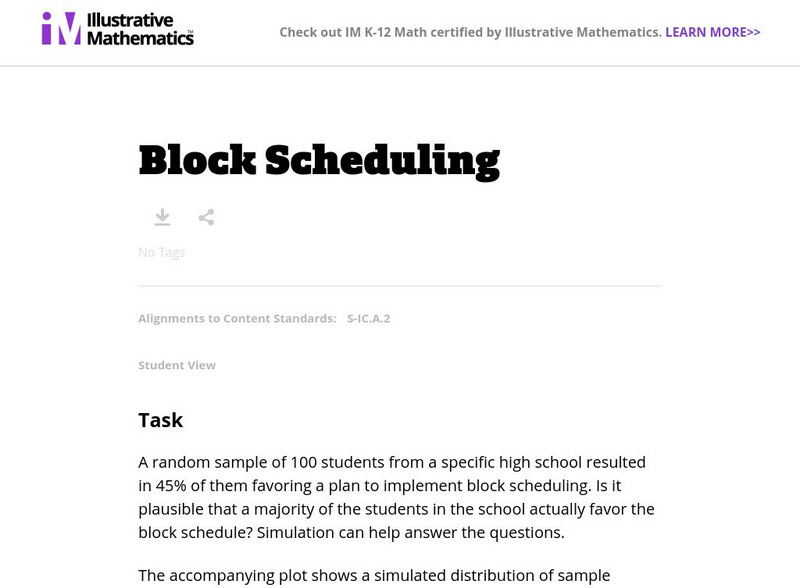
Illustrative Mathematics: S Ic Block Scheduling
A random sample of 100 learners from a specific high school resulted in 45% of them favoring a plan to implement block scheduling. Is it plausible that a majority of the students in the school actually favor the block schedule? Learners...
Other
Statistics Education Web: Bubble Trouble [Pdf]
Use random sampling to formulate, collect, and compare data from two populations. Written by Peter Banwarth of Oregon State University.
Illustrative Mathematics
Illustrative Mathematics: s.ic.4 the Marble Jar
Sometimes hotels, malls, banks, and other businesses will present a display of a large, clear container holding a large number of items and ask customers to estimate some aspect of the items in the container as a contest. In some cases,...
Illustrative Mathematics
Illustrative Mathematics: 7.sp Estimating the Mean State Area
The table below gives the areas (in thousands of square miles) for each of the lower 48 states. This serves as the population for this study. Your task involves taking small samples from this population and using the sample mean to...
National Council of Teachers of Mathematics
The Math Forum: Probability and Statistics
This page is a math home page that includes information on all topics of probability and statistics.
Vision Learning
Visionlearning: Statistics: Introduction to Inferential Statistics
An introduction to inferential statistics to find relationships and patterns in datasets.
Education Place
Houghton Mifflin: Eduplace: Math Steps: What Is It? Data
This is a great place for lesson information on the concept of analyzing data - measures of central tendency. Three other tabs are available besides the "What Is It?" link. Tips and Tricks, When Students Ask, and Lesson Ideas also...


![Statistics Education Web: Bubble Trouble [Pdf] Lesson Plan Statistics Education Web: Bubble Trouble [Pdf] Lesson Plan](https://content.lessonplanet.com/knovation/original/715465-988c4be74f96df36c2d9bcb6f2f5182f.jpg?1661829195)


