Curated OER
Perplexing Patterns
Seventh graders identify and find missing patterns. In this algebra lesson, 7th graders investigate numbers and sequences and complete the pattern. They make a chart and discuss similarities and differences.
Curated OER
Study of Chance
Seventh graders determine the fairness of various games. In this determining the fairness of various games lesson, 7th graders use spinners, dice, and rock,paper, scissors to play various chance games. Students determine if each game...
Curated OER
Bias in Statistics
Students work to develop surveys and collect data. They display the data using circle graphs, histograms, box and whisker plots, and scatter plots. Students use multimedia tools to develop a visual presentation to display their data.
Curated OER
The Dog Days of Data
Students practice an alternative form of data presentation. They practice sequencing data, identifying the stem-and-leaf, creating stem-and-leaf plots, and drawing inferences from the data by viewing the plots.
Curated OER
The Dog Days of Data
Students are introduced to the organization of data This lesson is designed using stem and leaf plots. After gather data, they create a visual representation of their data through the use of a stem and leaf plot. Students
drawing...
Curated OER
The Seasonal Round and The Cycle of Life
Fourth graders are introduced to the concept of the seasonal round and how folklife traditions vary from season to season. They begin charting dates of personal interest on seasonal round calendars by starting with birthdays. Students...
Curated OER
Smarties Investigation
In this math activity, students complete a variety of activities using Smarties candy. For example, students estimate the number of each color, count the actual amount, and record their results in a tally chart.
Alabama Learning Exchange
The State Capital of Stem and Leaf
Students explore the concept of stem and leaf plots. In this stem and leaf plots lesson, students plot the 50 US states' capitals on a stem and leaf plot according to the first letter of each state. Students compare their stem and leaf...
Curated OER
What I Didn't Know...
Students practice creating wikis. In this wiki lesson plan, students create a wiki about any math topic that they know nothing about. Students learn about their topic and create a wiki that explains the math topic in detail.
Curated OER
Halloween Graphitti
Learners complete multi-curricular activities in a Halloween themed lesson. In this Halloween lesson, students examine newspaper ads to find prices of pumpkins and use them to complete a stem and leaf plot. Learners find the diameter,...
Curated OER
Macbeth Madness
Students research Macbeth online and complete computer and graphing activities for the play. In this Macbeth activities lesson, students research Macbeth and bookmark the URL's. Students complete activities for the topic on spreadsheets...
Curated OER
Graph and Compare the Adventure's Temperature Vs. Local Temperature
Students explore the concept graphing data. In this graphing data lesson, students use weather data from their local weather and some other city and graph them. Students plot the local weather vs. another city. Students record...
Curated OER
How Far Can You Throw?
Sixth graders take a turn throwing the basketball and softball. They measure the distance in feet and inches between the starting and landing points of the balls. The recorder will record the distance each ball was thrown next to each...
Curated OER
Flying High in Math
Seventh graders study how real airplanes fly and then they construct models of paper airplanes using design resources for the Internet and their own design. They use meaurement and caluculations in order to help them construct their...
Curated OER
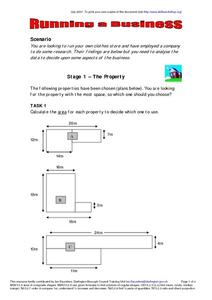
Running The Business
In this career worksheet, students are asked to look at the six stages necessary for the success of running a hypothetical new business.
Curated OER
Testing Weather Proverbs
Students study weather proverbs. In this weather lesson, students list weather proverbs and complete the worksheet to test the proverb. Students design an experiment to test the weather proverbs and conduct the experiments.
Curated OER
Historical Temperatures
Students research historical regional temperatures for their current season. In this historical weather lesson, students conduct weather station and Internet research to learn about historical regional temperatures. Students collect and...
Curated OER
How Wealthy Are Europeans?
Learners investigate measures of central tendency. They examine compiled data and conduct critical analysis. The graph is focusing on the gross domestic product data. The lesson also reviews the concept of putting values in order of...
Curated OER
Drops on a Penny
Eighth graders experiment to determine the number of drops of water a heads up penny hold. They create a stem and leaf graph of the class results and use the data for further experimentation on a tails up penny.
Curated OER
Water You Can Use from the Air Conditioner
Students work together to research water quantity, quality and safety standards. They complete a lab to discover how to use the water from an air conditioner. They write a paper to show their findings.
Curated OER
How Psychologists Do Research
Students discover how psychologists complete their research on different topics. In groups, they describe the elements of an experiment and the importance of sampling during research. They identify ethical issues in their research and...
Curated OER
Words To Numbers
Seventh graders explore the four steps to problem solving. After observing a problem solving chart and discussing each step, 7th graders solve individually assigned word problems. Upon completion, they share their information with the...
CK-12 Foundation
Ck 12: Statistics: Stem and Leaf Plots, Mean, Median, and Mode
[Free Registration/Login may be required to access all resource tools.] Find the mean, median, and mode of a set of data displayed in a stem-and-leaf plot.
Purple Math
Purplemath: Mean, Median, Mode, and Range
Mean, median, and mode are three kinds of "averages". The "mean" is the "average" you're used to, where you add up all the numbers and then divide by the number of numbers. The "median" is the "middle" value in the list of numbers. To...
Other popular searches
- Mean Median Mode Range
- Mean, Median, Mode Range
- Mean, Median, Mode, Range
- Median Mode Range
- Mean Median Mode and Range
- Mean, Median, Mode, and Range
- Median Mode and Range
- Mean, Median, Mode and Range
- Median, Mode, Range
- Statistics Median Mode Range


