Curated OER
Global Statistics
Students determine statistics based on data. In this statistics lesson, students use data and record in charts. Students create graphs based on the statistics found.
Curated OER
Evolution Lab
Students examine the pattern of natural variation in a society. They examine Darwin's theory of evolution and analyze data. They use computer programs to graphically display the variation in organisms.
Curated OER
Diffusion
Students design and carry out an experiment according to the scientific method. The experiment must test the effects of time and concentration on the rate of diffusion of potassium permanganate into potato cubes. After performing the...
Texas Instruments
Can You Breathe Like a Pinniped?
Young learners compare the breathing patterns of different animals in this pinniped lesson. They examine the breathing pattern of California sea lions and northern elephant seals. Pupils collect, compare and analyze data concerning...
Curated OER
Saving Energy Through Ecological Landscape Design
Students are able to transcribe to scale the plant features of a common landscape. They determine true north and south and collect and record data on a table. Students calculate a rating for and describe a definition of insulation and...
Curated OER
Listen to Your Heart
Sixth graders explore how exercise affects heart rate and use spreadsheets to record and analyze data.
Curated OER
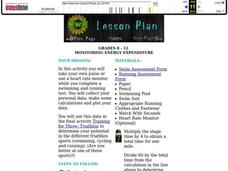
Monitoring Energy Expenditure
Students use heart rate monitors and complete a swimming and running test. These tests allow students to obtain personal data, to manipulate the data through calculations of various parameters, and to graphically represent the data.
Curated OER
A Healthy Heart
Sixth graders create a spreadsheet using specific data. A speaker comes to discuss the heart, and the difference between anaerobic and aerobic activity. They make posters to encourage a healthy heart lifestyle.
Curated OER
Saving Money Through Mathematics
Third graders discuss light sources and collect data about energy sources. They compare data and create a multiple line graph showing energy used by light sources for each student in the group. They present their graphs and write a...
Curated OER
Global Statistics
Students select appropriate data to determine the mean, median, mode and range of a set of data. They calculate the statistical data on literacy rates and life expectancy within each geographic region of the world. Students determine...
Curated OER
Exercise Those Statistics!
Students participate in various activities, measuring their pulse rates and recording the data. They analyze the statistical concepts of mean, median, mode, and histograms using the data from the cardiovascular activities.
Curated OER
Monitoring Energy Expenditure
Students use heart rate monitors and complete a swimming and running test. These tests allow students to obtain personal data, to manipulate the data through calculations of various parameters, and to graphically represent the data.
Curated OER
Crustal Sinking
Students measure the rate of sinking of a test tube into a beaker of "glop", representing a model of the interaction between the Earth's crust and upper mantle. This task assesses students' abilities to make simple observations,...
Curated OER
Water - Planning for the Future
Students explore and examine the increases and/or decreases for water user groups: irrigation, municipal, manufacturing, steam electric power generation cooling, livestock, and mining. They utilize percentage changes during their...
Curated OER
Jumping in the Air - What was your Height?
Students solve equations using the quadratic formula. In this quadratic equations lesson, students use digital cameras to film students jumping and import film clips into a computer. Students use the data in the quadratic formula...
Curated OER
Modeling Population Growth
Learners collect data on population growth. In this statistics lesson, students graph their data and make predictions. They find the linear regression and the best fit line.
Curated OER
Introduction to the Scientific Method
Young scholars designs and conduct a scientific experiment that identifies the problem, distinguishes manipulated, responding and controlled variables, collects, analyzes and communicates data, and makes valid inferences and conclusions.
Curated OER
Cardiovascular Homeostasis
High schoolers develop and conduct an experiment to answer the question," How does cardiovascular exercise affect the pulse rate?". They record the changes to heart rate during different levels of exercise.
Curated OER
The Labor Force and Unemployment
Young scholars calculate employment and unemployment rate. In this economics instructional activity, students investigate the labor market and make predictions based on collected data. They also calculate unemployment rate in the class.
Curated OER
Currency Exchange and the Gang of Fifteen
Learners demonstrate the ability to comprehend and calculate currency exchange rates.
Curated OER
A Matter of Fact
Students design their own Science experiment. In this science experiment lesson students create a hypothesis related to matter and test it. They displayed their data in a graph.
Curated OER
Communicable Disease
Young scholars use Palms, or handheld computers, and the Cooties software to enact the transmission of communicable diseases. They discuss incubation and immunity and collect and interpret data and figure out who was the "carrier "of a...
Curated OER
Pyramid of Biomass
Students interpret data to demonstrate biomass and number pyramids. They use information to draw conclusions and examine an example of biological magnification.
Baylor College
Needs of Plants
What better way to learn about plant life than by creating a class garden? Young botanists start with a brief discussion about radishes before planting seeds and watching them grow. To determine the importance of water, sunlight, and...


