Illustrative Mathematics
Ratio of Boys to Girls
How many boys are in the class? Here is an introductory exercise describing ratios. The commentary shows different ways learners can approach the problem, using a tape diagram of boys to girls and using a table. The activity includes...
Illustrative Mathematics
Art Class, Assessment Variation
Play with paint and decide the ratio to make different shades of green. When mixing paint colors, your painters should decide which ratios make the same shade and what is needed to mix other ratios for a different shade of green. This is...
Curated OER
How Fast is Usain Bolt?
Revisit the 2012 Summer Olympics by having seventh graders calculate the unit rate sprinting speed of the 100-meter gold medal winner.
Illustrative Mathematics
Cooking with the Whole Cup
Whoops! Travis accidentally put too much butter into the recipe. Your bakers must find out how to alter the recipe to accommodate different changes by using unit rates and ratios . The activity has multiple parts and calculations with...
Illustrative Mathematics
Sand Under the Swing Set
Help the local elementary school fix their playground by calculating the amount of sand needed near the swing set. The problem practices setting up proportions and ratios with three different options for solving. You can chose the option...
Curated OER
Stock Swaps, Variation 3
More on the fictitious takeover of the Apple Corporation by Microsoft. In this scenario, Microsoft has $28.00 per share to spare, so how many do they need to offer to make an even trade? This is an engaging problem to solve when...
101 Questions
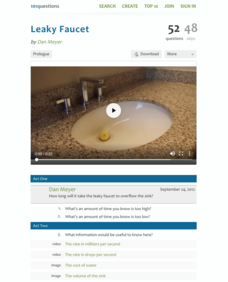
Leaky Faucet
A dripping faucet may be enough to drive you crazy, but it also teaches you a little about ratios. Presented with the volume of a sink and the rate the water is dripping, scholars must devise a plant to determine how long it will take...
PBS
The Lowdown — Exploring Changing Obesity Rates through Ratios and Graphs
Math and medicine go hand-in-hand. After viewing several infographics on historical adult obesity rates, pupils consider how they have changed over time. They then use percentages to create a new graph and write a list of questions the...
101 Questions
Gas Light
You don't want to leave any learners stranded! Explore ratios using an analysis of gas mileage and distance. Given a scenario, individuals must determine if a car has enough gas to make it to the next gas stop.
101 Questions
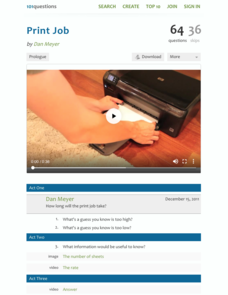
Print Job
A watched printer never finishes—or does it? Engage your classes in a ratio and proportion task that asks them to predict how long it takes to print the numbers one through 88 on 88 sheets of paper. They use video to determine the rate...
Illustrative Mathematics
Buying Bananas, Assessment Version
Practice with unit rates, proportions, and ratios when Carlos purchases an amount of bananas. Learners must interpret a graph to decide whether points on the same line represent similar proportional relationships. Use with lesson plans...
101 Questions
Finals Week
What energy drinks have the highest concentration of caffeine? Pupils compare five energy drinks with different amounts of caffeine and different volumes. They must solve the ratios to understand the differences. An extension compares...
Illustrative Mathematics
Running at a Constant Speed
The learner must use the given constant speed to find the unit rate. A table is made in order to relate the speed to the time and the distance. From the table, learners are able to see the unit rate in miles per minute and miles per...
Illustrative Mathematics
Robot Races
Analyze data on a graph to answer three questions after a robot race. Learners practice comparing ratios and reading points on a graph. Answers may vary on the last question based on accuracy of graphing. Use the lesson along with...
Illustrative Mathematics
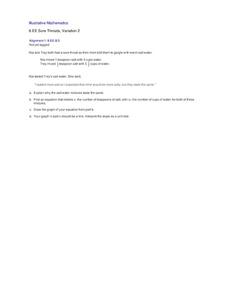
Sore Throats, Variation 2
What does math have to do with a sore throat? When you mix water and salt you have a great review of how to represent proportional relationships by an equation or graph. Here the proportions of the mixtures may be different, but the...
Illustrative Mathematics
Gotham City Taxis
Taxi! Have your travelers figure out how far they can go in a taxi for $10.00. They must account for the mileage rate and tip in their calculation. They can set up a table or make an equation to solve for the exact mileage they can...
Curated OER
Carbon 14 Dating in Practice II
Your archaeologists combine proportional reasoning with exponential functions in a real-life task centered on Carbon 14 dating.
Curated OER
Stock Swaps, Variation 2
If Microsoft wanted to take over Apple, how many shares would they need to break even? This is an ideal task for seventh graders who are studying proportional relationships and applying them to real-world scenarios. Use it as an...
Gfletchy
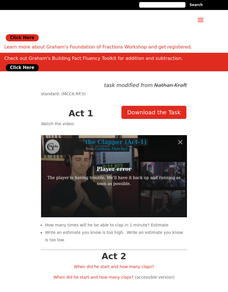
The Clapper
Give a round of applause for completing the task. Scholars watch a video that shows an extremely fast clapper and a timer. The activity requires applying concepts of rates and proportional reasoning to estimate the number of claps in one...
101 Questions
Thanksgiving Taters
What would a meal be without the taters? The question is, how long does it take to peel those potatoes? Given the rate of peeling one potato, scholars predict the time it takes to peel the bag. The twist is that the first potato was...
Illustrative Mathematics
Buying Gas
A quick problem to test your middle schoolers' knowledge of dividing with decimals. Also a good practice of unit rates, they must compute the cost of one gallon of gas when given the total amount for a fill up. Can be used as a preface...
101 Questions
Shower v. Bath
Which requires more water--a bath or a shower? Given some specific criteria, learners attempt to answer the question. A video shows how long it takes to fill a gallon container using a faucet and a shower head. Using that information and...
101 Questions
Pedestrian Countdown
You won't find yourself racing the clock on such a great task. Scholars use video information to predict the time left on a crosswalk signal after a pedestrian crosses. The video shows the time left on the counter, and individuals must...
Gfletchy
Thumbs on Fire
How fast are those thumbs? Pupils view a short video showing a person typing out a text message in a speed challenge. They use the information they can glean from the video to estimate the number of seconds it will take to completely...


