Curated OER
Cindy and Linda - Selling Lemonade
In this pie charts worksheet, learners use the pie chart to count how many glasses of Lemonade were sold by Cindy and Linda. Students complete the table and answer 3 questions.
Curated OER
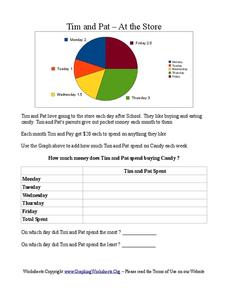
Tim and Pat - At the Store
In this pie chart activity, students use the pie chart to add the amount of time Tim and Pat spend buying candy each day of the week. Students answer 2 questions about the table.
Curated OER
Mathematics: Best Salary
Sixth graders pretend to need jobs to earn money for a go-cart which costs $1,000. They predict which of two scenarios raise the money first. they construct charts and graphs to demonstrate their predictions.
Curated OER
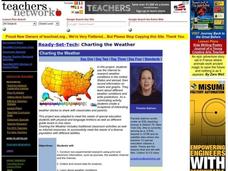
Charting the Weather
Students research and conduct non-experimental research, such as journals, the weather channel and the internet, to collect and record data for analysis on weather conditions in the United States and abroad. They identify, pronounce and...
Curated OER
Bird and Breakfast
Students examine winter birds. In this KWL chart lesson, students fill out the chart and view a PowerPoint presentation. Students then complete the chart and discuss winter birds.
Tech Know Teaching
5th Grade Constructed Response Question
New to constructed response question worksheets? Here's a model that demonstrates how to construct questions that require readers to interpret graphics found in informational text.
Curated OER
Education for Global Peace
Fifth graders construct data graphs based upon sets of data. In this graphing instructional activity, 5th graders read the text If the World Were a Village and discuss how types of graphs accurately represent a large population. Students...
Curated OER
What's The Weather?
Second graders record and summarize daily weather observations for a week in the form of a bar graph. They cut and glue a weather symbol for each day, record it on the graph, and answer discussion questions.
Curated OER
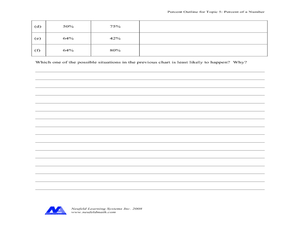
Percent of a Number
In this percent worksheet, students complete problems such as changing percents to decimals, filling in percentage charts, and more. Students complete 8 problems.
Curated OER
Science and Technology
Students research inventions that have been created. In this historical technology lesson, students read the Harcourt Brace social studies textbook and discuss how inventors used graphs to display data. Students create a table to write...
Curated OER
Best Practices
Students are encouraged to do their best on the mile run portion of the fitness test. They also gain knowledge about fitness in other academic areas of the school too. In science, the class records resting pulse rates, in math, charts...
Curated OER
Historical Population Changes in the US
Students conduct research on historical population changes in the U.S. They conduct Internet research on the Historical Census Data Browser, create a bar graph and data table using a spreadsheet program, and display and interpret their...
Curated OER
James and the Giant Peach Plot Analysis
It's all about the plot, main events, and story mapping with this lesson. As the class reads the novel James and the Giant Peach, they create an excitement graph that actually charts key events and moments of excitement. After creating...
Curated OER
Pizza! Pizza!
Third graders tally, sort, and organize pizza orders from monthly school sales. They create an advertising campaign to promote the School Pizza Sale, record the data in graph form, compare and contrast the tallies throughout the year,...
Curated OER
A Research Project and Article For the Natural Inquirer
Get your class to use the scientific process to solve a scientific problem. They utilize the Natural Inquirer magazine to identify a research question which they write an introduction to and collect data to answer. They use graphs,...
Curated OER
Yummy Math
Young mathematicians use bags of Skittles to help them gain practice in graphing and organizing data. They work in pairs, and after they have counted and organized their Skittles, they access a computer program which allows them to print...
ARKive
Handling Data: African Animal Maths
Handling and processing data is a big part of what real scientists do. Provide a way for your learners to explore graphs and data related to the animals that live on the African savannah. They begin their analysis by discussing what they...
Curated OER
Understanding "The Stans"
Students explore and locate "The Stans" in Central Asia to create, write and illustrate maps, graphs and charts to organize geographic information. They analyze the historical and physical characteristics of Central Asia via graphic...
EngageNY
Discovering the Topic: Inferring and Confirming Using Evidence
Allow your class to figure out what they will be studying through an inquiry-based anticipatory set that involves analysis of mystery documents and practice with making inferences. The lesson plan document includes a detailed description...
iCivics
The Fourth Branch: You!
Take time to remind your young learners of the valuable understanding that each branch of the United States government is really composed of other citizens. The reading material and worksheets of this resource cover the importance of...
Curated OER
It's Your Life - Safe or Sorry/Safety Issues
Young scholars examine and chart data about safety hazards and unsafe situations. In this safety hazard lesson, students examine newspapers and web sites to investigate injuries from safety hazards. They make a spreadsheet using the data...
Curated OER
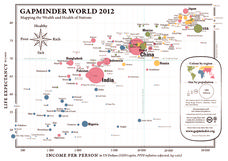
Gapminder World 2012
Here is a very interesting infographic that compares the average life expectancies, per capita incomes, and population sizes of every country in the world in 2012.
Curated OER
My Secret War: Lesson 1
Fifth graders explore historical fiction. In this genre study lesson plan, 5th graders go on a text feature scavenger hunt to identify the parts of a historical fiction text. Additionally, students read the book, My Secret War and...
Curated OER
Constitution/Impeachment/Reconstruction
Eleventh graders analyze a chart comparing U.S. census data from 1850, 1880, 1900, and 1920. They read a handout summarizing immigration legislation from 1882-1996 and create a graph charting how open / closed U.S. immigration is over time.


