Curated OER
Evidence of Change Near the Arctic Circle
Students analyze graphs and make conclusions about climate change. In this climates lesson students produce graphs and identify relationships between parameters.
University of North Texas
Library of Functions
Join the family picnic and see how all the functions come together in a PowerPoint that highlights their main features. As it includes topics such as domain, range, and intercepts, the slides are a great guide to promote class discussions.
K12 Reader
Displaying Data
It's important to learn how to display data to make the information easier for people to understand. A reading activity prompts kids to use context clues to answer five comprehension questions after reading several paragraphs about...
K12 Reader
What Is a Glyph?
After reading a short passage about glyphs, kids must follow the provided directions to create a star glyph.
Curated OER
Graphing Made Easy
Fourth graders discover the appropriate way to construct and analyze bar, line, picto, and circle graphs. They set up frequency tables and perform some statistical analysis (mean, median, and mode) on their data.
Curated OER
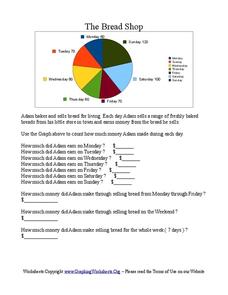
The Bread Shop
In this pie chart worksheet, learners use the pie chart graph to count the money Adam made in the Bread Shop. Students complete 10 questions.
Curated OER
Which Amusement Park Would You Choose?
Students analyze data related to amusement parks and create a spreadsheet to display the data. They read the data and predict which amusement park they think is safer, create a spreadsheet and graph, and write a proposal based on their...
Curated OER
Statistics Problems
In this statistics learning exercise, 3rd graders answer questions about different graphs including bar graphs, picture graphs, line graphs, and more. Students complete 20 multiple choice questions.
Curated OER
The Numbers Tell the Story
Students demonstrate how to gather and interpret statistical data. In this data analysis lesson, students search for statistics on the health effects of smoking and place the information into charts. Students create these charts online...
Curated OER
Reading Graphs
Students read graphs and charts to interpret results. In this algebra lesson, students interpret bar, line and pictographs. They draw conclusions and make predicitons based on these charts.
Curated OER
Collecting Data
In this data collection worksheet, students read about how data is collected and organized. They also learn about a hypothesis. Students read through examples of different charts and then answer 23 questions pertaining to data...
Curated OER
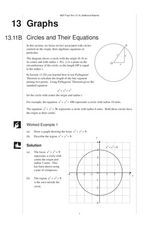
Circles and Their Equations
In this circle and their equations worksheet, students read about circles and algebraic equations, look at examples and complete exercises.
Curated OER
Australian Settlers
Students interpret graphs and research events to identify links between events in the world and the arrival and plight of immigrant groups. They discuss the myths about immigration.
Curated OER
Creating a Graph
Students brainstorm favorite things to do during the summer. They survey classmates to collect data, arrange it in a chart, and create graphs using ClarisWorks.
Curated OER
Piece of Pie Chart
In this math worksheet, young scholars examine a pie graph which shows a student's homework over 2 hours. Students read the information, then use a pie chart template (divided into 24 parts) to make their own homework chart.
Curated OER
Discovering Pi
Define terminology related to a circle. Practice accuracy in measuring and then create a spreadsheet based on data collected from solving for parts of a circle. Groups can have fun analyzing their data as it relates to Pi.
Curated OER
Transformations in the Coordinate Plane
Your learners connect the new concepts of transformations in the coordinate plane to their previous knowledge using the solid vocabulary development in this unit. Like a foreign language, mathematics has its own set of vocabulary terms...
Mathematics Assessment Project
Middle School Mathematics Test 3
Real-life mathematics is not as simple as repeating a set of steps; pupils must mentally go through a process to come to their conclusions. Teach learners to read, analyze, and create a plan for solving a problem situation. The provided...
Curated OER
Sunshine Math 3
In this word problems worksheet, learners read and problem solve nine mathematical word problems involving grids, measurement, compensation and angles.
Curated OER
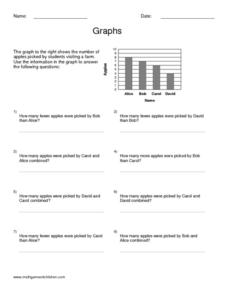
Graphs
In this algebra worksheet, students calculate the point of intersection between a circle and a straight line. There are 5 questions with an answer key.
Curated OER
Pies and Percentages--Learning About Pie Graphs
In this pie graph worksheet, students draw a pie graph for the zookeeper with the data he collected, choose a different color for each animal species and make a key to the graph.
Curated OER
Getting Graphs: Researching Genealogy-A Piece of Pie
Third graders research their genealogy. In this math lesson, 3rd graders collect data and create graphs and charts. A presentation of their findings is given.
Mathematics Vision Project
Module 6: Congruence, Construction, and Proof
Trace the links between a variety of math concepts in this far-reaching unit. Ideas that seem very different on the outset (like the distance formula and rigid transformations) come together in very natural and logical ways. This unit...
University of California
Seasons Lab Book
Unlock the mystery behind seasonal change with a collection of worksheets and activities. Whether they are drawing pictures of Earth's orbit around the sun or graphing the temperature and daylight hours of different locations from around...


