Inside Mathematics
Sorting Functions
Graph A goes with equation C, but table B. The short assessment task requires class members to match graphs with their corresponding tables, equations, and verbalized rules. Pupils then provide explanations on the process they used to...
EngageNY
Modeling Linear Relationships
Math modeling is made easy with the first installment of a 16-part module that teaches pupils to model real-world situations as linear relationships. They create graphs, tables of values, and equations given verbal descriptions.
Mathed Up!
Inequalities Regions
Discover how to solve systems of inequalities by graphing. An informative video shows pupils how to determine the solution set after graphing each inequality of a system. To finish, a worksheet gives them a chance to practice this skill.
CK-12 Foundation
CK-12 Middle School Math Concepts - Grade 6
Twelve chapters cover a multitude of math concepts found in the Common Core standards for sixth grade. Each title provides a brief explanation of what you will find inside the chapter—concepts from which you can click on and learn more...
Curated OER
Run, Gingerbread Men, Run!—Game
Run, gingerbread men! During the board game, four gingerbread men race to discover which one finishes first. Scholars take note of the game's results using a tally chart and bar graph for all to observe the frequency of the winning...
Curated OER
Every Graph Tells A Story
Seventh graders explore linear equations. In this graphing lesson, 7th graders explore constant rates of change. Students discover the real-life application of graphs and demonstrate their ability to read graphs and write corresponding...
Curated OER
Graph Your Motion
Students graph their linear equations. In this algebra instructional activity, students examine their lines and relate it to the slope or rate of change. They relate the steepness of the line to the slope being positive, negative or zero.
Curated OER
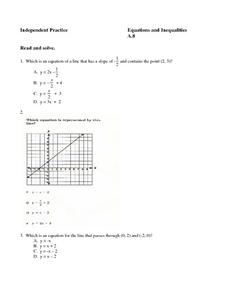
Equations: Graphs, Lines, Slope
In this equations worksheet, students complete 8 multiple choice questions regarding writing equations in slope-intercept and matching an equation to its graph in the coordinate plane.
Curated OER
Get the Picture with Graphs
Fifth graders examine line, bar and circle graphs in the newspaper and on the Internet. They complete sketches of graphs with an emphasis on selecting the best model to depict the data collected.
Curated OER
Creating and Reading a Pictograph
Second graders examine how data can be transferred into pictures on a pictograph. They analyze data on a graph about chewing gum, and create a pictograph that illustrates data about their preferences for the taste of bubble gum. ...
Curated OER
Bar Graphs
In this bar graphs worksheet, students, working with a partner, explore how to read and analyze the five answers to one mathematical bar graph.
Curated OER
Line, Ray, Segment
Learners define vocabulary words. In this geometry lesson, students identify the graph as a line, ray or segments. They understand the properties of each and calculate the distance on a number line.
Curated OER
Advanced Critical Reading: Generations
In this critical reading worksheet, students read a passage about cycles of American generations then answer three questions based on the reading.
Curated OER
Graphs: All About Our Class
Students respond to survey questions, discuss results, brainstorm ways to represent survey information, and create table of class results. They find mean, range, and percentages, and create graph to display results.
Curated OER
Classroom Supplies
Challenge young mathematicians to buy classroom supplies by staying within the means of a $1,000 budget. The mathematical activity provides learners with the opportunity to decide what items from the supply list would benefit a class of...
Curated OER
Ordering Integers
Sixth and seventh graders compare and order integers. After locating integers in a newspaper, they describe examples of negative and positive integers. They draw a thermometer and locate positive and negative integers on the scale. In...
Alabama Learning Exchange
Building Functions: Inverse Functions from Tables and Graphs
Is the inverse a function? Scholars learn how to examine a function to answer this question. Using an online interactive, they examine the properties of inverse functions to compare to the original function.
K12 Reader
Displaying Data
It's important to learn how to display data to make the information easier for people to understand. A reading activity prompts kids to use context clues to answer five comprehension questions after reading several paragraphs about...
Curated OER
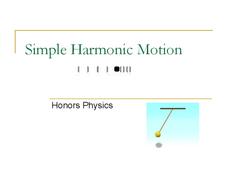
Simple Harmonic Motion
Back and forth, and back again. A presentation on harmonic motion would make a great backdrop for a directed instruction lesson in Honors Physics. It includes diagrams, formulas, graphs, and a few sample problems.
EngageNY
Real-World Positive and Negative Numbers and Zero
Class members investigate how positive and negative numbers are useful in the real world. Individuals first read a short passage and identify terms indicating positive and negative numbers. They consider situations involving positive...
University of California
Seasons Lab Book
Unlock the mystery behind seasonal change with a collection of worksheets and activities. Whether they are drawing pictures of Earth's orbit around the sun or graphing the temperature and daylight hours of different locations from around...
Curated OER
Graphing Inequalities
Students graph inequalities on a number line and discuss how to solve for one variable. The teacher models examples as students take notes. In groups, students participate in an activity to demonstrate inequalities on a number line. ...
Curated OER
Graphing Linear Equations Using Data Tables
Pupils review the Cartesian plane and the process of plotting points. In groups, students create tables, identify the slope and y-intercept, and graph the equation. Afterward, pupils perform the same process, only, individually. As a...
Curated OER
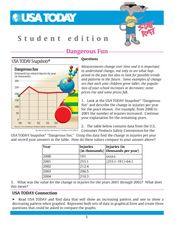
Dangerous Fun
In this line graph worksheet, students analyze the data on a graph about toy-related injuries by year. Students solve 5 problems in which the change in injuries per year is calculated and recorded on a table.


