Curated OER
Treasure Hunt: Coordinate Graphing
Two of the best words any one can hear– treasure hunt! Your class will be excited to practice graphing on a coordinate grraph as they identify and write coordinates for landmarks they see on a treasure map. They trace their route to the...
K12 Reader
Absolute Location
Where in the world are we? As a reading comprehension exercise, kids read a short passage about navigation using latitude and longitude, and then respond to a series of questions based on the article.
Curated OER
Graphing Functions With 2 Points and From a Graph
Students plot points on a coordinate plane. They describe, in words, methods for finding the slope of a line. After given a worksheet, students read instructions, draw a Cartesian plane, plot ordered pairs, and graph lines. Papers are...
Curated OER
Which Amusement Park Would You Choose?
Students analyze data related to amusement parks and create a spreadsheet to display the data. They read the data and predict which amusement park they think is safer, create a spreadsheet and graph, and write a proposal based on their...
Curated OER
Lines of Fit
Students graph an equation and analyze the data. In this algebra lesson plan, students graph scatter plots and identify the line of best fit using positive correlation, negative correlation an d no correlation. They apply their data...
Curated OER
Hollywood's Top Ten
Young scholars gather data on top 10 highest grossing movies, and make a bar graph and a pictogram.
Curated OER
Reading Graphs
Students plot functions on the Cartesian coordinate plane. They explore lines and parabolas. Students analyze graphs and answer questions about the information presented on the graph using an online program.
Curated OER
Reading Graphs
Students read graphs and charts to interpret results. In this algebra lesson, students interpret bar, line and pictographs. They draw conclusions and make predicitons based on these charts.
Illustrative Mathematics
Walk-a-thon 1
Your mathematician's job is to explore the relationship between hours and miles walked during a walk-a-thon. The activity compels your learners to experiment with different means in finding out this proportional relationship. The answer...
Utah Education Network (UEN)
Mathematics: Growing Patterns
Learners graph growing patterns using ordered pairs on a coordinate grid. They read The Fly on the Ceiling, a Math Myth.
Sinclair Community College
Solving Linear Inequalities
Your learners will appreciate the complete picture of linear inequalities presented in this lesson plan. Starting simply with definitions and moving all the way to solving linear inequality word problems this activity is simple to follow...
Baylor College
What Makes Water Special?
Get close up and personal with a drop of water to discover how the polarity of its molecules affect its behavior. Elementary hydrologists split and combine water droplets, and also compare them to drops of oil. Much neater than placing a...
Baylor College
Dust Catchers
In class, your emerging environmentalists construct dust catchers. They take them home for a week or two, and then bring them back into class to examine under a magnifier. From this activity, they learn what makes up dust and that...
Curated OER
Bisphenol A and Diabetes
Pupils summarize the data that is displayed and examine how bisphenol A behaves and how it contributes to diabetes. Learners also study an article and interpret line graphs.
Curated OER
Electric Field Mapping / Equipotential Lines
Students determine the equipotential lines surrounding a charged object. In this physics lesson, students draw lines to identify areas. They relate the spacing of the field lines to the strength of the charge.
Curated OER
Point Graphs
Students experiment with point graphs. In this math lesson, students are divided into groups and perform an experiment to see how high a ball bounces, recording their results on a point graph. Students then answer provided questions.
Curated OER
Read, Recognize & Graph Integers
Students explore negative and positive integers on a number line. They review a newspaper to determine careers that use positive and negative integers. In groups, they read and answer questions on "Lifestyles of the Rich and...
Curated OER
Graphing Fun In Third Grade
Third graders display information in a graph, table, and chart. In this data lesson plan, 3rd graders look at graphs, tables, and charts, discuss their importance, and make their own.
Curated OER
Immigration Graphs
Fourth graders study immigration. In this graphing lesson, 4th graders make a population graph of people who have immigrated to Indiana.
Curated OER
Using A Table
In this table activity, learners observe information in a table, and then answer ten questions pertaining to the information. They must correctly read a table in order to arrive at the correct answer. Questions pertain to features of a...
Curated OER
Rise Over Run
High schoolers define the slope of the line, find the slope between any two points on the line, and allow them to name other areas where the slope is used. They explain why the slope is defined as the rise over the run.
Curated OER
Graphs
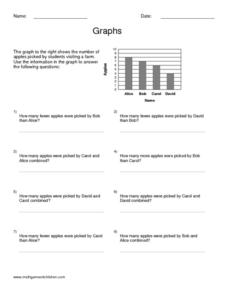
In this algebra worksheet, students calculate the point of intersection between a circle and a straight line. There are 5 questions with an answer key.
Curated OER
What's Your Favorite Planet?
Fourth graders, after listing the nine planets and their differences, choose one planet as their favorite. From the information acquired on each students favorite planet, they make a graph illustrating their favorites and then transform...
Curated OER
Creating a Graph
Students brainstorm favorite things to do during the summer. They survey classmates to collect data, arrange it in a chart, and create graphs using ClarisWorks.


