Curated OER
Pages Out of the Past
Students examine examples of rock art and the reasons why they were made. They translate the images into a creative writing piece that be attached to their own rock art.
Curated OER
Rock Art Stories
Students examine different types of rock art. They analyze them to try to figure out the meaning of the art. They create their own rock art that tells a story. They share their creation with the class.
Curated OER
Dr. Teeth and Dr. Gums To The Rescue
Second graders role play as dentists researching teeth and their care. They create a slide show showing how a character, Bear, can take care of this teeth explaining habitats, diets and teeth.
Curated OER
Vocabulary Charts
Seventh graders are introduced to the vocabulary associated with archeology. Using a dictionary, they practice finding the meaning of various words and create sentences. They also identify an appropriate use of the word and draw an...
Curated OER
Math Made Easy
Young scholars evaluate word problems. In this problem solving lesson plan, students are presented with word problems requiring graphing skills and young scholars work independently to solve.
Curated OER
Making Sense of the Census
In this unit of lessons, students make sense of the Census. They examine why a census is taken and participate in activities.
Curated OER
One Square Foot
Students identify, describe, count, tally, and graph life found in one square foot of land.
Curated OER
What is a Cloud
Third graders study clouds and how they are formed. They write acrostic poems about clouds and analyze and graph temperature data collected during varying degrees of cloud cover.
Curated OER
Rock Art
Students create replica symbols of rock are found in Wisconsin and work cooperatively to create a rock art panel. They observe rock art to find their meanings and reasons why they were created.
Curated OER
Year of the Impossible Goodbyes by Sook Nyul Choi
Students analyze Korean culture from their literature piece. They investigate the theme of oppression by an occupying army. Students encounter courage, resistance movements and explore the underground railroads.
Curated OER
On Our Way to School
First graders create a class graph that illustrates how they get to school and interpret data from the graph. They complete an assessment worksheet independently and answer questions about the graph shown.
Curated OER
Favorite Christmas Carols
Third graders take a survey of friends' and family members' favorite Christmas carols. They illustrate a favorite Christmas carol and have students try to guess the name of the carol based on the picture.
Curated OER
Going My Way?
Students discuss how each one of them leaves school each day. They create and analyze a class graph displaying the information collected.
Curated OER
Do You See What I See?
Students observe and describe different objects seen under a microscope and compare the individual perspectives of what was seen.
Curated OER
Heads-Up Probability
Second graders use tree diagrams to predict the possible outcomes of coin tosses. The data they collect and graph also help them predict the likelihood of getting heads or tails when tossing coins the next time.
Curated OER
The Stock Exchange Phase I
Second graders select a stock and follow its ups and downs, using graphs to show its success.
Curated OER
We Are Having a Party! Part I
Second graders use data analysis skills in order to plan a class party. They graph possible times for the party noting the range for times. They discuss how mathematicians find and use the range to analyze data.
Curated OER
The effects of microgravity
Fourth graders are given a scenario in the lesson that presents a problem that needs to be solved. They conduct research from multiple sources in order to gather information. This is used to contribute to possible solutions proposed by...
Curated OER
On the Road Again": Moving People, Products, and Ideas
In this lesson students learn how to identify modes of transportation and communication for moving people, products, and ideas from place to place. Students also study the advantages and disadvantages of different modes of...
Khan Academy
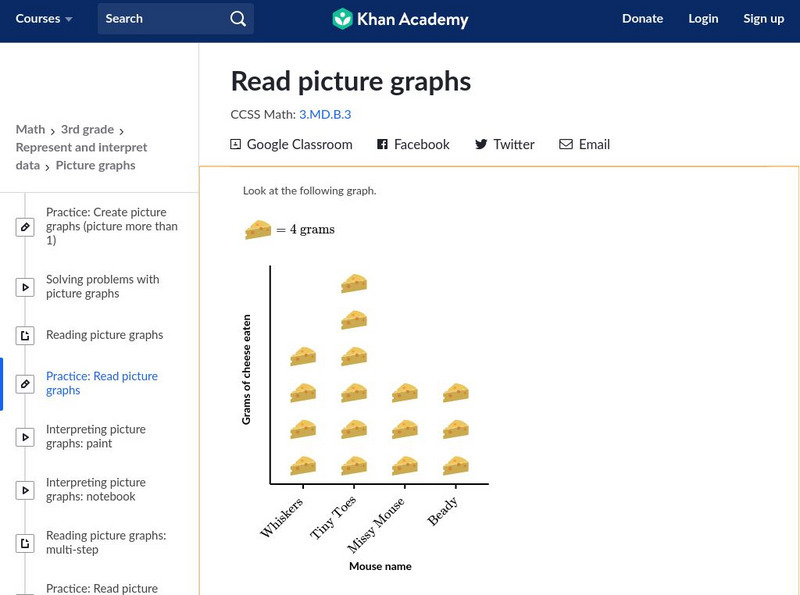
Khan Academy: Read Picture Graphs
Use picture graphs to solve word problems. Students receive immediate feedback and have the opportunity to try questions repeatedly, watch a video or receive hints. CCSS.Math.Content.3.MD.B.3 Draw a scaled picture graph and a scaled bar...
Khan Academy
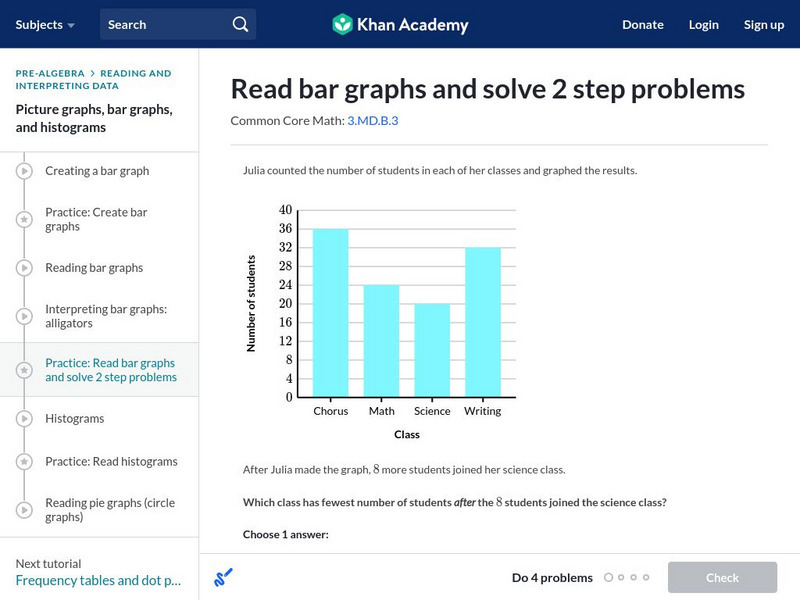
Khan Academy: Read Bar Graphs and Solve 2 Step Problems
Read and interpret a double bar graphs. Students receive immediate feedback and have the opportunity to try questions repeatedly, watch a video or receive hints. CCSS.Math.Content.3.MD.B.3 Draw a scaled picture graph and a scaled bar...
Khan Academy
Khan Academy: Picture Graphs (Pictographs) Review
Picture graphs are a fun way to display data. This article reviews how to create and read picture graphs (also called pictographs).
Glenbow Museum
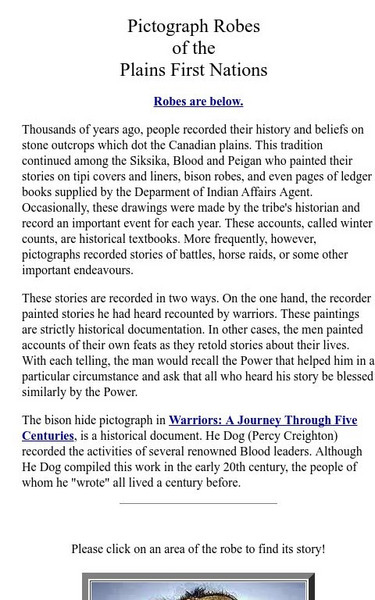
Glenbow Museum: Pictograph Robes of the Plains First Nations
Here is a brief article on the use of pictograph robes to record the "stories of battles, horse raids," and other events. Click on part of the pictograph robe photograph to read the story recorded on that portion.
ClassFlow
Class Flow: Pictograph With Key Greater Than 1
[Free Registration/Login Required] This flipchart introduces reading a pictograph with a key greater than one, answering questions from data represented, find number of symbols to represent data by using a key, construct pictograph, and...


