Pennsylvania Department of Education
Freckle Face
Students collect and record data. In this early data analysis lesson, students gather data about their partners face. As a class, the students use tally marks and pictographs to record the data and answer question about the information...
Curated OER
Monopoly Graphs
Students relate the concepts of linear functions to the game of monopoly. For this algebra lesson, students solve problems with ratio and proportion. They collect data and graph it.
Curated OER
Button Bonanza
Collections of data represented in stem and leaf plots are organized by young statisticians as they embark some math engaging activities.
Curated OER
Statistics and Probablility
Statistics and Probability are all about collecting, organizing, and interpreting data. Young learners use previously collected data and construct a picture graph of the data on poster board. This stellar lesson should lead to...
Curated OER
Speed
Fifth and sixth graders practice working in pairs to determine whether they can walk with constant speed. They test themselves, collect their data, draw graphs with their data collected, manipulate the data, and then draw conclusions...
Utah Education Network (UEN)
The Human Line Plot
Learners collect data and use charts and line plots to graph the data. Some excellent worksheets and activities are embedded in this fine lesson plan on line plots.
Curated OER
Conversation Heart Graphing
Sixth graders review the different types of graphs (bar, line, pictograph) They predict the data set they can garner several boxes of conversation hearts. Students record their data using an Excel spreadsheet. They create a graph based...
American Statistical Association
Colors Challenge!
Does writing the name of a color in a different colored ink affect one's ability to read it? Scholars design an experiment to answer this question. They collect the data, analyze the statistics, and draw a conclusion based on what they...
NOAA
Tracking a Drifter
Be shore to use this drifter resource. The third installment of a five-part series has learners using the NOAA's Adopt-a-Drifter website to track to movement of a drifter (buoy) in the ocean. Graphing the collected data on a map allows...
Statistics Education Web
Walk the Line
How confident are you? Explore the meaning of a confidence interval using class collected data. Learners analyze data and follow the steps to determine a 95 percent confidence interval. They then interpret the meaning of the confidence...
Statistics Education Web
I Always Feel Like Somebody's Watching Me
Future statisticians and potential psychics first conduct an experiment to collect data on whether a person can tell if someone is staring at them. Statistical methods, such as hypothesis testing, chi-square tests, binomial tests, and...
US Department of Agriculture
Sink or Float?
Will it sink or will it float? Learners predict the outcome as they drop random objects into a container of water. Then, they keep track of the results and record the data in a t-chart to draw a final conclusion.
American Statistical Association
Armspans
Young mathematicians collect data on the arm spans of classmates. Then they sort the data by measures of center, spread, and standard deviation. Finally, they compare groups, such as boys and girls, to interpret any differences.
Statistics Education Web
Population Parameter with M-and-M's
Manufacturers' claims may or may not be accurate, so proceed with caution. Here pupils use statistics to investigate the M&M's company's claim about the percentage of each color of candy in their packaging. Through the activity,...
Howard Hughes Medical Institute
Scientific Inquiry Using WildCam Gorongosa
How do scientists determine what questions to ask to meet their research goals? Help your class develop an inquiry mindset with a lesson based on studies in the Gorongosa National Park. Partners create their own research questions by...
Berkshire Museum
Reduce, Reuse, and Recycle: Sorting Through Personal Choices
Raise children's awareness about the importance of conservation with this hands-on science lesson plan. Start by breaking the class into groups and having them collect trash from around the school or local park. Students then use the...
Curriculum Corner
Our Classroom Birthdays
Combine getting to know one another and math with a worksheet that focuses on graphing birthdays. Scholars collect data to discover how many peers share birthday months and fill in a bar graph for visual representation.
NOAA
The Oceanographic Yo-yo
How does chemistry help deep-sea explorers? Part four of a five-part series of lessons from aboard the Okeanos Explorer introduces middle school scientists to technologies used in ocean exploration. Groups work together to analyze data...
Curated OER
Water Meter Reader
Junior high schoolers learn how to read a water meter, track their family water usage, and discuss the amount in class with other pupils. They will interpret real-world data and graph it. It is ideal for increasing awareness and...
Curated OER
Favorite Candy Bar Graph
Students decide on six different types of candy bars to include in a data collection activity. Working in small groups, they survey a target group in a set amount of time. They access a Internet based graphing tool to create a bar graph...
Curated OER
Getting A Grip On Graphs
Fourth graders investigate the concept of graphing and comparing different types of data using pictographs, line graphs, scatter plots, etc... They gather data and make interpretations while examining the medium of how it is displayed.
Curated OER
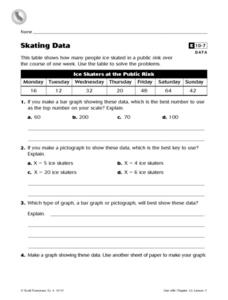
Skating Data
In this collecting data worksheet, 4th graders view a table on ice skaters at a public rink in order to answer 2 multiple choice questions, 1 short answer question and make a graph showing one piece of the data.
Curated OER
Graphing Conversation Hearts
Students collect data and create a graph. In this mathematics lesson plan, students separate paper hearts by color and create a graph showing the number of hearts of each color present. Students receive a handful of candy hearts that...
Curated OER
Graphing with Stems-and -Leafs
Fourth graders examine the use of stem and leaf graphs. For this stem and leaf graph lesson, 4th graders participate in teacher led lesson showing the use of the graphs. They work in groups to collect data about peanuts before making a...


