Curated OER
Testing Weather Proverbs
Students study weather proverbs. In this weather lesson, students list weather proverbs and complete the worksheet to test the proverb. Students design an experiment to test the weather proverbs and conduct the experiments.
Curated OER
Graphing Data - Temperature
Seventh graders measure and record temperature over a given time period. They compare the recorded temperatures to the 40-year recorded normal average temperatures for the same area. Students display and interpret their findings in a graph.
Curated OER
Weather Proverbs
Students investigate various concepts related to weather. They conduct historical research to see how the study of weather originated and the application of the latest technologies in the field. Students summarize the information with...
Curated OER
Severe Weather Planning
Fourth graders research the need to prepared for a severe weather event. They select one type of weather condition and explain how to be prepared in a report.
Curated OER
Student Weather Journal
Students recognize different types of cloud patterns and associate these patterns with certain types of weather. They predict the weather for the next 6 to 24 hours. They then improve their observation skills as they check on the weather...
Curated OER
Earth's Weather
Seventh graders learn how solar radiation, latitude, and other factors affect weather. They break into six groups and are assigned a topic to research and to present their findings orally.
National Wildlife Federation
Citizen Science to the Rescue!
You don't have to be a scientist or even out of high school to contribute to scientific research. In the 12th lesson in the series of 21, scholars use this opportunity to add to the growing body of scientific knowledge and consider the...
Curated OER
Clear Day, Cloudy Day; Weather, Cloud Types and Formations
Students explore the formation of clouds and different cloud types. Students simulate a cloud formation within a bottle.
Curated OER
Ground Level Ozone
Students analyze real-time data and predict the level of ground ozone in their home city. They measure the level of ground ozone, submit their data to an online collaborative project, and create a web page presenting the dangers of...
Curated OER
Hurricanes
Eighth graders gather information on hurricanes that are affecting the world at the time of the lesson. They work together in groups to collect the data and record their information in a table. They are asked questions to finish the lesson.
Curated OER
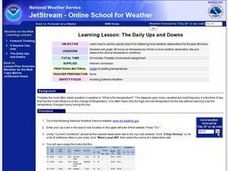
Learning Lesson: Ups and Downs
Students use the internet to find the air temperatures in their area. They create a graph based on the data. They analyze the data and examine tips for avoiding extreme weather.
Curated OER
Trends of Snow Cover and Temperature in Alaska
Students compare NASA satellite data observations with student surface measurements of snow cover and temperature. They practice data collection, data correlations, and making scientific predictions.
Curated OER
How Do Weather Conditions and Lunar Cycles Affect Fishing Success?
Pupils use weather measuring devices to record and study weather conditions at different locations, during different times. They attempt to draw conclusions about the relationship between weather conditions, lunar cycle and fishing success.
Curated OER
Hot, Wet, and Cold
Pupils research climate data for a city in each of the 5 major geographic sections of Texas. They use data to describe the climate and what influence the geography of that section has on the weather.
Curated OER
School Temperatures
Young scholars collect and record temperatures throughout the school. Using this information they compare and contrast the temperatures recorded from various spots throughout the school.
Curated OER
Blooming Thermometers
Students study phenology, or the study of climate change. They research the Japanese springtime festival of Hanami and plot and interpret average cherry blossom bloom date data from the past 1100 years.
Curated OER
What's the Chance?
Students study probability and statistics by conducting an experiment, recording their results, and sharing data with classmates.
Curated OER
Observing Fall Migrants
Pupils observe the migration of monarch butterflies. They collect data regarding the number of monarchs they see, the location, the butterflies' behavior, the temperature and the date and time. Then they send their data to a university...
Curated OER
Creeping
Young scholars observe, measure, and graph a model of slow down slope movement representing soil creep. This task assesses students' abilities to collect, record, and organize data, set up graph axes, plot data points, draw line graphs,...
Curated OER
Holey Clamshells
Students analyze data to make hypotheses and conclusions regarding the predator/prey relationship between moon snail and surf clams.
Curated OER
Reasons for the Seasons
This worksheet requires the pupils to follow a teacher activity, so more-than-the-usual preparation for a practical is needed. Looking at a globe as it rotates and receives "sunlight" from a flashlight, pupils are able to observe the...
Curated OER
How Does a Migration Move Forward?
Students record and examine migration data, and calculate how fast and far a migrating animal travels and what influences its progression. They utilize the Journey North website to follow their migrating animals.
Curated OER
Seasonal Cloud Cover Variations
High schoolers recognize different cloud types. They determine the seaonality of various types of clouds. They graph the data and determine if a correlation exists between season, cloud cover and type of clouds most prevalent during each...
Curated OER
Frogs: Fact or Folklore
Students discover how frogs are adapted to their environment. They view and discuss a Discovery Channel video on frogs and the myths surrounding frogs. In small, groups they compile data on frogs from the internet to create a Frog Fact...


