Curated OER
Collect the Weather Lesson Plan
Students explore the weather. In this weather spreadsheet activity, students keep track of weather patterns as they use instruments and resources to chart the data the collect in spreadsheet form.
Curated OER
Weather Predictions
Students play the role of weather personalities by making five day forecasts based on data gathered from observations, weather instruments, and weather maps. Each day a small group makes a class forecast for the next day and reviews the...
Curated OER
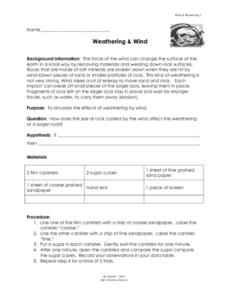
Weathering and Wind
In this weathering and wind worksheet, students simulate the effects of weathering by wind using 2 canisters, 2 types of sandpaper and 2 sugar cubes. Students swirl the sugar cubes inside the canisters lined with fine and course...
Curated OER
Our Desert Backyard
Students make observations of their own backyard. In this environment lesson, students keep records of the plants and animals they see in their home or school yard. Students make notes of how the weather and environment changes over...
Curated OER
Probability
Third graders conduct experiment, collect data, predict, record, and discuss outcomes, and analyze data for probability.
Curated OER
Graphing Changes in Weather
Students graph current temperature and weather conditions for three days. In this weather instructional activity, students go to the Weather Channel's website and look up weather for their zip code then graph the conditions and...
Curated OER
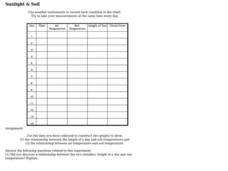
Sunlight & Soil
In this earth science learning exercise on sunlight and soil, students use data collected in a chart to construct two graphs. Following, they answer five questions as they relate to the experiment performed.
Curated OER
Going Local with Global Warming
Students examine climate change by using recent temperature records. In this data analysis lesson students plot weather data and study the differences between weather and climate.
Curated OER
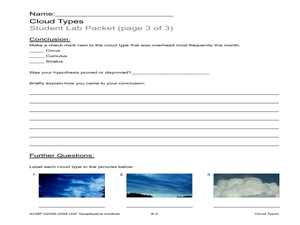
Cloud Types
Students examine cloud types. In this cloud lesson, students identify cloud types, observe clouds and collect data, and analyze data to identify the most common cloud they observe overhead during the course of a month.
Curated OER
Weather "Whys" : Introduction to Weather
Students discuss weather forecasts and different types of weather. In this weather lesson, students observe the weather and learn a weather song. They listen to a story and see weather measurement tools.
Curated OER
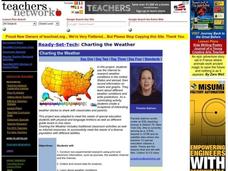
Charting the Weather
Students research and conduct non-experimental research, such as journals, the weather channel and the internet, to collect and record data for analysis on weather conditions in the United States and abroad. They identify, pronounce and...
Curated OER
Observing and Predicting Weather from a Weather Station
Fourth graders us a Weather Log data chart to record the date, time, day, and weather. They discuss different instruments and charts needed to record the information. Students turn in their weather logs at the end of two weeks and...
Curated OER
Weather Observations
Students record the weather using an outdoor thermometer. In this weather lesson plan, students compare their recordings to that on the weather map online. Students explain the differences of each weather reading. Students continues...
Curated OER
Weather Conditions
In this weather conditions worksheet, students use a month of recorded weather conditions to create a graph comparing the number of days it was cloudy, raining, or clear. This worksheet has a graphic organizer and a graph.
Curated OER
The Fabled Maine Winter
Young scholars graph and analyze scientific data. In this research instructional activity students use the Internet to obtain data then draw conclusions about what they found.
NOAA
El Niño
El Nino, La Nina ... and the Santa Maria? The 11th installment of a 23-part NOAA Enrichment in Marine sciences and Oceanography (NEMO) program explains the mechanism of El Nino/Southern Oscillation. Pupils use previous data to determine...
PBS
Twirling in the Breeze
Blow classes away with a hands-on lesson investigating wind speed. Learners use common materials to design and construct anemometers. They then test their anemometers and collect data on the wind speed created by a fan.
Curated OER
Citizen Scientist - Collect Some Data
In this science project worksheet, students view a sheet of numerous science projects including weather, animals, flowers, and more. Students choose 1 project to do out of 22 projects total.
Curated OER
Weather: The Climate
Students observe the weather each day and record what he or she sees. They can record his or her data in any appropriate manner, from drawing pictures of a sunny sky to recording the temperature and rain fall on a chart.
Curated OER
Clouds and the Weather
Fourth graders analyze the relationship of clouds and local weather. Students also observe and record cloud data and weather conditions daily as they research different cloud types. The data is analyzed looking for trends in daily...
Curated OER
Weather, Migrations, and Plants
Students research the effects of day-to-day weather on animal migrations, plant growth and other seasonal events. They consult maps, observe and record local conditions, keep journals and use their collected data check hypotheses.
Curated OER
Weather Instrument Data Chart 2
In this science worksheet, high schoolers look for the data that is needed to fill in the graphic organizer. The prefixes are given that are needed to sort the information as it is collected.
Curated OER
Chart the Weather for Cities Around the World
Students orally describe Northern and Southern hemispheres, identify 7 continents, and point out specific countries and cities. They locate and record weather information.
Curated OER
Weather Watchers
Second graders discuss what weather is and list words that can be used to describe weather. In this science lesson, 2nd graders develop symbols for each type of weather and record the weather for two weeks at the same time and the same...


