Curated OER
Beary O'Mometer Learns About Careers In Meteorology
Students explore the field of meteorology. In this meteorology lesson, students explore weather-related careers as they research the field of study as well as various weather concepts. Students interview meteorologists, write business...
Curated OER
Graphing the Forecast - Line Graph or Bar Graph?
Sixth graders compare and contrast bar and line graphs. Using a weather forecast of the area, 6th graders record the high and low temperatures in a table. Students determine and justify the most appropriate graph to display a given set...
Curated OER
Feeling the Heat
Pupils record temperatures at different locations around campus. They examine the results and draw conclusions about how materials and colors affect the amount of heat produced. They also analyze Los Angeles' temperature records over a...
Curated OER
What Goes Up Must Come Down!!
Fifth graders look at actual sunrise and sunset times for their hometown to determine a pattern in the amount of daylight. They collect their data in Excel and create a chart to help them identify the pattern, then write an explanation...
Curated OER
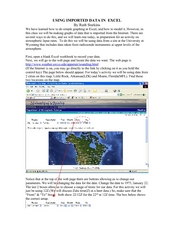
Using Imported Data in Excel
Students import atmospheric data from the internet. In this earth science activity, students graph the data they collected. They complete the worksheet after the activity.
Curated OER
Weather Conditions During the Fall Monarch Migration
Students keep detailed weather records during the fall migration of the monarch butterfly. They compare weather conditions to the days they do and do not see monarchs. As a class, they graph and analyze data and send it to a university...
Curated OER
Measuring Wind Speed
Students study wind speed and collect wind speed data. In this wind speed lesson, students visit a website to learn about the local wind speed forecast for their week. Students discuss wind and wind speed. Students collect wind speed...
Curated OER
The Accuracy of Climate Data
Students use maps to determine how accurate climate data really is. They also answer questions using a table of data.
Curated OER
Climate Change in My City
High schoolers investigate the climate changes occurring locally, regionally and globally over the last one hundred years. They brainstorm and predict whether the current year's weather was warmer or colder than last year then check the...
Curated OER
Our City's Temperature
Young scholars use a thermometer to record temperatures from their homes throughout the city, and then hypothesize reasons for the temperature variations. They use a weather graph worksheet that's imbedded in this lesson plan to...
Curated OER
Graph and Compare the Adventure's Temperature Vs. Local Temperature
Students explore the concept graphing data. In this graphing data lesson, students use weather data from their local weather and some other city and graph them. Students plot the local weather vs. another city. Students record...
Curated OER
Keeping a Daily Weather Log
Young scholars create their own daily log books for recording and keeping track of the weather.
Curated OER
Weather Watchers
First graders study changes in daily weather conditions. They explore weather pattern consistency.
Curated OER
Weather Patterns and Acid Rain (or What is Chicago's acid rain doing in the Adirondacks?)
Students examine a color-coded map of U.S. acid rain precipitation intensity. Using EPA data table and the blank U.S. map, they record state-by-state values for magnitude of emissions and compare areas of emissions to areas with the most...
Curated OER
Weather Math Student Worksheet
In this math worksheet, learners record the high and low daily temperatures for their home city or another location. Students average the temperatures and make comparisons. As a bonus activity, learners answer 3 questions after going to...
Curated OER
Weather: Like It or Not!
Second graders investigate daily weather changes. In this earth science lesson, 2nd graders identify the different terms used to describe weather. They use the outdoor thermometer to record data.
Curated OER
Weather Watchers
Students watch the weather. In this science observation lesson, students collect data regarding the local weather and create their own weather forecasting video.
Curated OER
Interdisciplinary Task: Weather
Students design a chart to use to record the weather for five days. They then build an anemometer to record wind speed and discover why they are used for this purpose.
Curated OER
Weather Awareness
Second graders investigate weather. In this weather lesson, 2nd graders discover how to read a temperature gauge, keep track of the weather, and find out how the weather affects their day. They work individually and in partners to make...
Curated OER
Weather: It Works, or Not?
Young scholars discover the techniques meteorologists use to examine the atmosphere. In groups, they build their own weather station and observe the various weather conditions. They identify the types of weather patterns that allow the...
Curated OER
Isolines on a Weather Map
Ninth graders explore weather by analyzing maps. In this temperature lesson, 9th graders view black and white weather maps of locations in which the weather changes often. Students identify the isolines used on the maps and utilize the...
Polar Trec
What Can We Learn from Sediments?
Varve: a deposit of cyclical sediments that help scientists determine historical climates. Individuals analyze the topography of a region and then study varve datasets from the same area. Using this information, they determine the...
Curated OER
Texas Weather Report
Students use provided links to observe selected weather sites and collect temperature and precipitation data for listed cities. They enter the information onto their spreadsheet. Students study maps of the Texas natural reagions,...
Curated OER
Seasons and Cloud Cover, Are They Related?
Students use NASA satellite data to see cloud cover over Africa. In this seasons lesson plan students access data and import it into Excel.


