Curated OER
Probability With a Random Drawing
Students define probability, and predict, record, and discuss outcomes from a random drawing, then identify most likely and least likely outcomes. They conduct a random drawing, record the data on a data chart, analyze the data, and...
Curated OER
Eyewitnesses to Change
Students explore recent changes in the Artic's climate that have been observed by Artic residents. They watch videos, take notes and create a concept map. They also look at historical weather data from a specific Artic community. The...
Curated OER
Forecasting Weather
In this weather activity, students conduct an experiment where they record the weather observations for a week. Then they determine the air pressure using an aneroid barometer and estimate the amount of sky covered by clouds. Students...
Curated OER
Weather Log
Pupils develop the skill of recording weather observations. Not only students be responsible for recording visual observations of the sky, but also collecting and recording weather instrument data.
Curated OER
Observing Fall Migrants
Students keep a detailed data collection log of the different types of monarch behavior. They track the weather conditions daily and link it to the migration of the monarchs. They summarize their data using either a graph or a computer...
Curated OER
Weather It's Right or Not
Fifth graders explore weather forecasting. For a week, 5th graders observe weekly weather forcasts on different television channels. They predict which station is more accurate with their predictions. Students record and chart...
Curated OER
Calendar & Weather Book
Second graders track weather patterns through the school year. They take daily readings and record them in a weather book.
Curated OER
Weather Wise
Students investigate weather and how to forecast it. They discuss the three types of clouds and the kind of weather they bring. After setting up a database, they reearch weather-related websites to check cloud conditions and weather...
Curated OER
Weather Instruments
Students research weather instruments. In this weather instructional activity, students use the Global Climate DVD and take notes on weather instruments. Students answer multiple choice questions on a worksheet.
Curated OER
Wet Weather, Wet Climate
Students discover the differences between weather and climate in this long-term lesson introduction. They create rain gauges and practice reading rainfall measurements, view a website showing the cloud cover in their location and draw...
Curated OER
Splish, Splash Poetry
Students write weather shape poems and sing weather related songs. For this creative writing lesson, students read the book, It's Raining, It's Pouring and list weather words they heard in the story. Students use the writing process to...
Curated OER
Historical Temperatures
Learners research historical regional temperatures for their current season. In this historical weather lesson, students conduct weather station and Internet research to learn about historical regional temperatures. Learners collect and...
Curated OER
Cloud Forecast
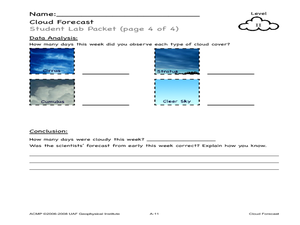
Students record weather observations and research online weather data. In this weather observations lesson, students study the cloud cover for several days and record their observations in a chart. Students identify the cloud types and...
Curated OER
Comparing Forecasts To Today's Weather
First graders compare forecasts to today's weather. They gather information about today's weather and record it on a chart. Students record information on the weather and discuss the importance of forecasts.
Curated OER
Reading A Weather Map
Ninth graders construct a weather map. In this meteorology lesson, 9th graders construct a weather map using contour lines and temperature.
Curated OER
Basic Excel
Students explore basic Excel spreadsheets. In this spreadsheet lesson plan, students enter Alaska weather information and perform calculations. Students title the columns on the spreadsheet and format the cells. ...
Curated OER
Heat Transfer Demos
Step-by-step instructions are given for two hands-on activities. Young scientists cut out a paper spiral and hold it over a hot plate to demonstrate convection, and they place a small piece of wax on the end of a metal rod opposite the...
Curated OER
Temperature High and Lows
Students gather high and low temperature readings through email. In this temperature graphing lesson, students use a spreadsheet to input data for a graph. students interpret the graphs to compare and contrast the data from different...
Curated OER
Bar Graphs
Students perform operations and graph their data using charts and bar graphs. In this algebra lesson, students follow specific steps to make a bar graph. They create a survey about people favorite things and plot their data from the...
Curated OER
What Are My Chances?
Students calculate probability. In this lesson on probability, students use given data to calculate to chances of a given event occurring. Many of the calculations in this lesson are applicable to daily life.
Curated OER
Measuring Snowfall
Students predict the amount of snowfall for the week and measure snowfall. In this measuring snowfall activity, student use a precipitation gauge to measure the week's snowfall; and analyze the data to determine whether or not...
Curated OER
Circle the Earth - Explore Surface Types on a Journey around Earth
Students use CERES percent coverage surface data with a world map in locating landmasses and bodies of water at Earth's Equator.
Curated OER
Weather Conditions During the Spring Monarch Migration
High schoolers keep a detailed record of weather patterns during the spring migration of the monarch butterfly. The use of weather reports is used to form a class data sheet. This lesson connects to the skills of graphing and critical...
Curated OER
Surface Meteorological Observation System (SMOS)
Young scholars monitor local surface weather conditions for at least 30 days. They interpret the data by graphing it and detemining percentages.


