US Department of Commerce
How Are Single-Parent Households Distributed Across the United States?
There sure are a lot of single-parent households in the country. After selecting one of four US regions to investigate, pupils create dot plots and box plots on the percentage of single-parent households with male parents and female...
Global Oneness Project
Living with Less Water
Did you know that California produces two thirds of the fruits and nuts consumed in the United States? That it produces almost one third of the vegetables? Did you know that scientists warn that California is facing the onset of a...
Curated OER
Max Knows Mexicao, United States and Canada
Students utilize their map skills to explore the regions of North America. They explore the physical characteristics and climates of the regions. Students label their map and prepare a presentation of their findings.
Curated OER
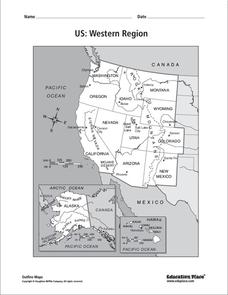
US: Western Region Map
In this United States Western Region learning exercise, students examine the state boundaries and landforms found in this region. The map also highlights each of the state capitals.
University of California
The Civil War: The Road to War
The United States Civil War resulted in the highest mortality rate for Americans since the nation's inception. Delve deeper into the causes for the drastic separation of states with a history lesson plan that features analysis charts,...
Curated OER
Fifty States Field Day
Students explore the 50 states in preparation for a special field day. On the actual field day, the oldest students in the school manage each of 50 physical activity stations. They share information about each state and introduce the...
National Energy Education Development Project
Introduction to Wind Energy
The U.S. produced enough wind energy in 2015 to power all of the homes in Alaska, California, Delaware, the District of Columbia, Hawaii, Idaho, Maine, Montana, Nebraska, New Hampshire, North Dakota, Rhode Island, South Dakota, and...
Curated OER
Social Studies: Regions of the United States
Third graders create Powerpoint presentations of various geographic regions of the United States. They focus on the Northeast, Southeast, and Midwest regions. Students combine their individual slides into a class presentation.
Curated OER
United States Regions
Fifth graders identify the regions of the United States. They gain general knowledge of Regions of the U.S., create a spreadsheet and use word processing to create a report.
Curated OER
Jimmy Carter: Civic Action, Lesson 1
Inspired by the humanitarian work of President Jimmy Carter after he left office, high schoolers explore the history of civic action in the United States and generate ideas about problems at the local, national, and international levels....
US Mint
The Growth of a Nation
Young historians explore the identity of the early United States in this four-part lesson series. Working in groups of three, students research the political, economic, and cultural atmosphere of each member of the...
Curated OER
Travelogs
Students make travelog journals to send to acquaintances in other states in order to receive mail in return. They make scrapbooks with the return mail they receive.
Curated OER
Culture Regions of the U.S.
Students identify the location of different cultural groups within the United States (agricultural, retirement, urban, etc.) They map these areas and analyze the correlation between the landscape of a given region and the type of...
Curated OER
Solving the Puzzle
Students create a map showing the United States borders at a specific period in history and produce three questions to be answered by examining the map. They also write a productive paragraph explaining who, what, when, where, how/why a...
Curated OER
Stop the Fighting and Start Uniting
Research current and proposed peace talks around the world with this New York Times lesson, Using the Darfur peace talks in Abuja, Nigeria as a starting point, middle schoolers create a news program on the subject. They propose a future...
CK-12 Foundation
Interpretation of Circle Graphs: Northwest Region Population Pie
Given populations of the five Northwestern states, learners create a circle graph. Using the data and the pie chart, they make comparisons between the populations of the states. Finally, the pupils determine how the chart will change...
National Endowment for the Humanities
The 1828 Campaign of Andrew Jackson: Changes in Voting Participation
Learners give examples to indicate how voting participation changed in the first half of the 19th century, and make connections between changes in voting participation and the results of the election of 1828.
Curated OER
Where Did My Lunch Come From? A U.S. Regional Tour
Young scholars explore the five regions of the United States. In this social studies lesson, students discuss the regions and the states located in that region. Young scholars discuss the types of food produced in each region and analyze...
Curated OER
Where Did My Lunch Come From? A U.S. Regional Tour
Students explore the regions from which their food comes. For this social studies lesson, students identify the different agricultural products that are found in the major regions of the United States. Students create a lunch menu.
Curated OER
United States of America
For this writing worksheet, students read short paragraphs about United States facts. Students then generate questions about the paragraphs using given facts.
Curated OER
U.S. Geography for Children: State Capitals
For this United States map skills worksheet, students locate and label specified states and their capitals, and create icons and a map key to show something for each state that is famous. Students answer 5 questions.
California Polytechnic State University
Australian Geography Unit
At the heart of this resource is a beautifully detailed PowerPoint presentation (provided in PDF form) on the overall physical geography of Australia, basic facts about the country, Aboriginal history, and Australia culture and lifestyle.
Curated OER
Mapping Population Changes In The United States
Students create a choropleth map to illustrate the population growth rate of the United States. They explore how to construct a choropleth map, and discuss the impact of population changes for the future.
Curated OER
The Demographics of Immigration: Using United States Census Data
Learners work together to analyze United States Census data on immigration. They compare and contrast the data and determine how immigration numbers have changed over time. They calculate percentages and make their own conclusions...


